 16
16peptides
spectra
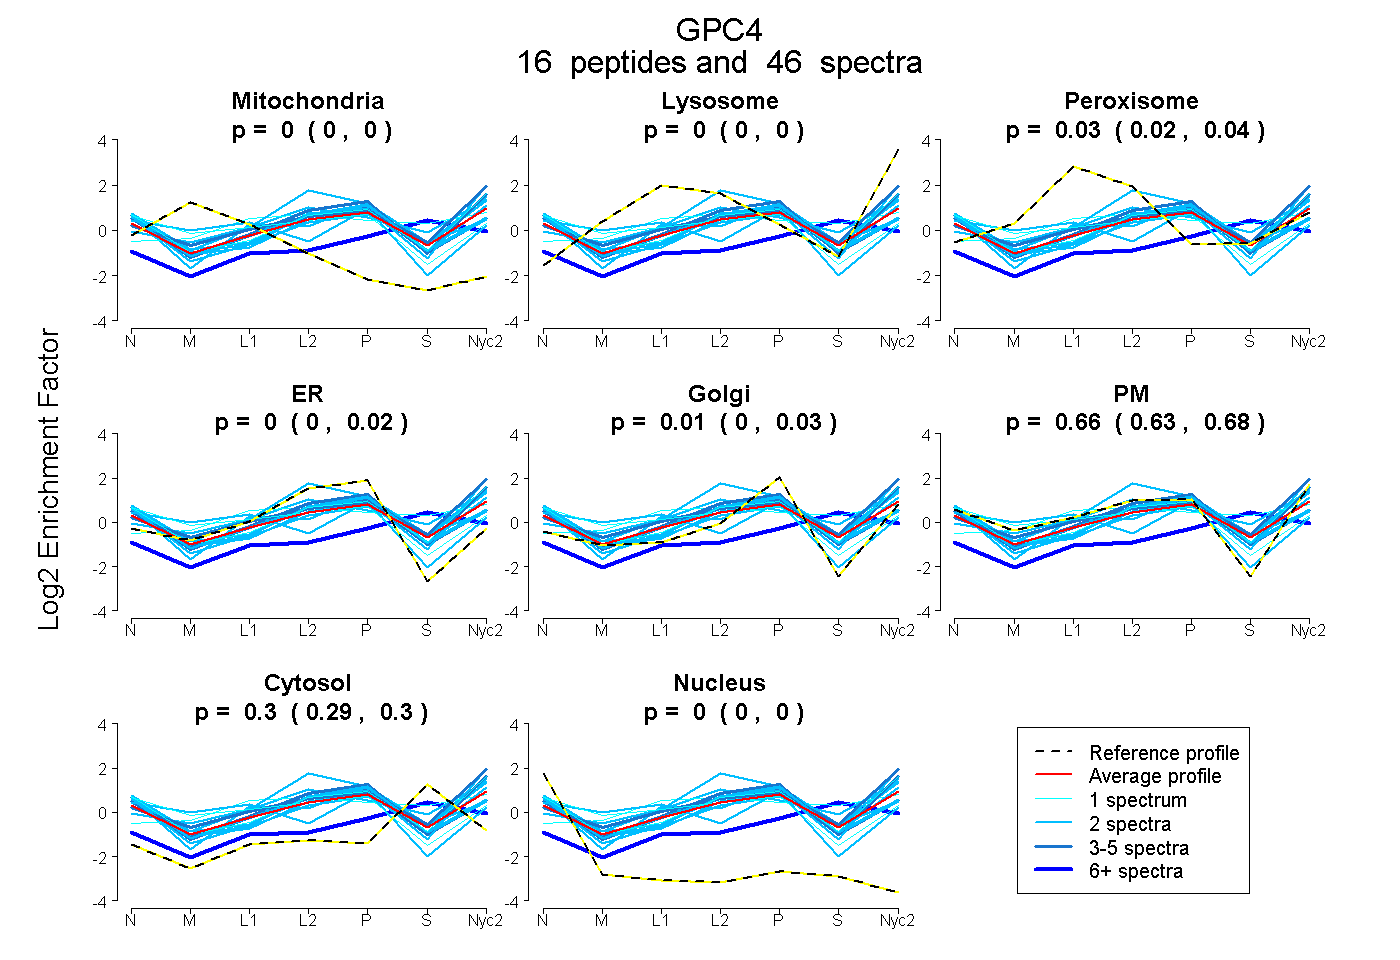
0.000 | 0.000
0.000 | 0.000
0.016 | 0.039
0.000 | 0.022
0.000 | 0.031
0.626 | 0.681
0.288 | 0.304
0.000 | 0.000
2peptides
spectra
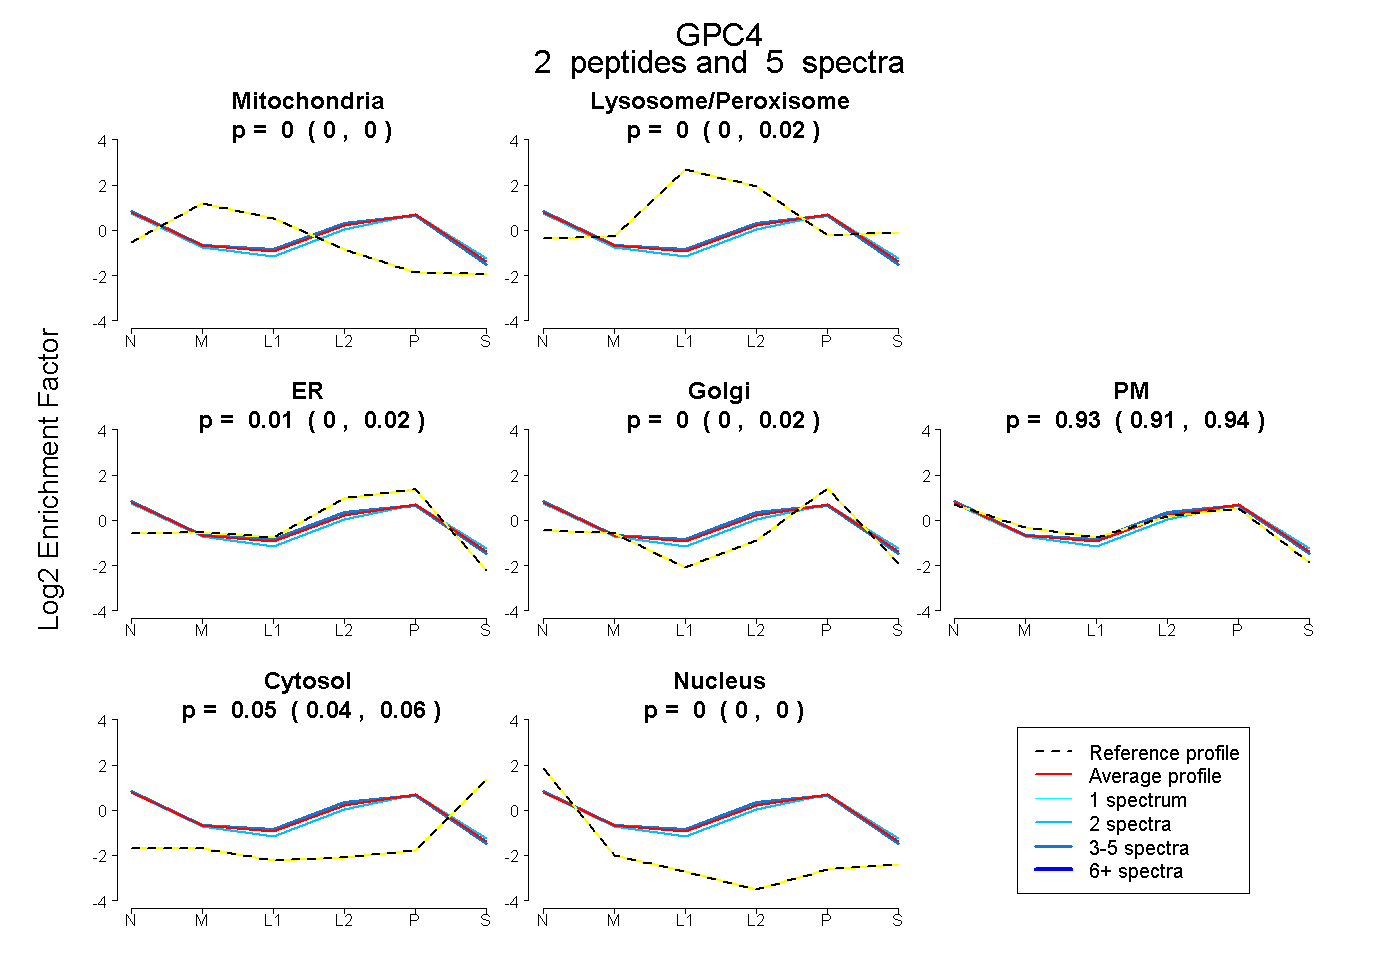
0.000 | 0.000
0.000 | 0.017
0.000 | 0.024
0.000 | 0.022
0.912 | 0.940
0.044 | 0.059
0.000 | 0.000
10peptides
spectra
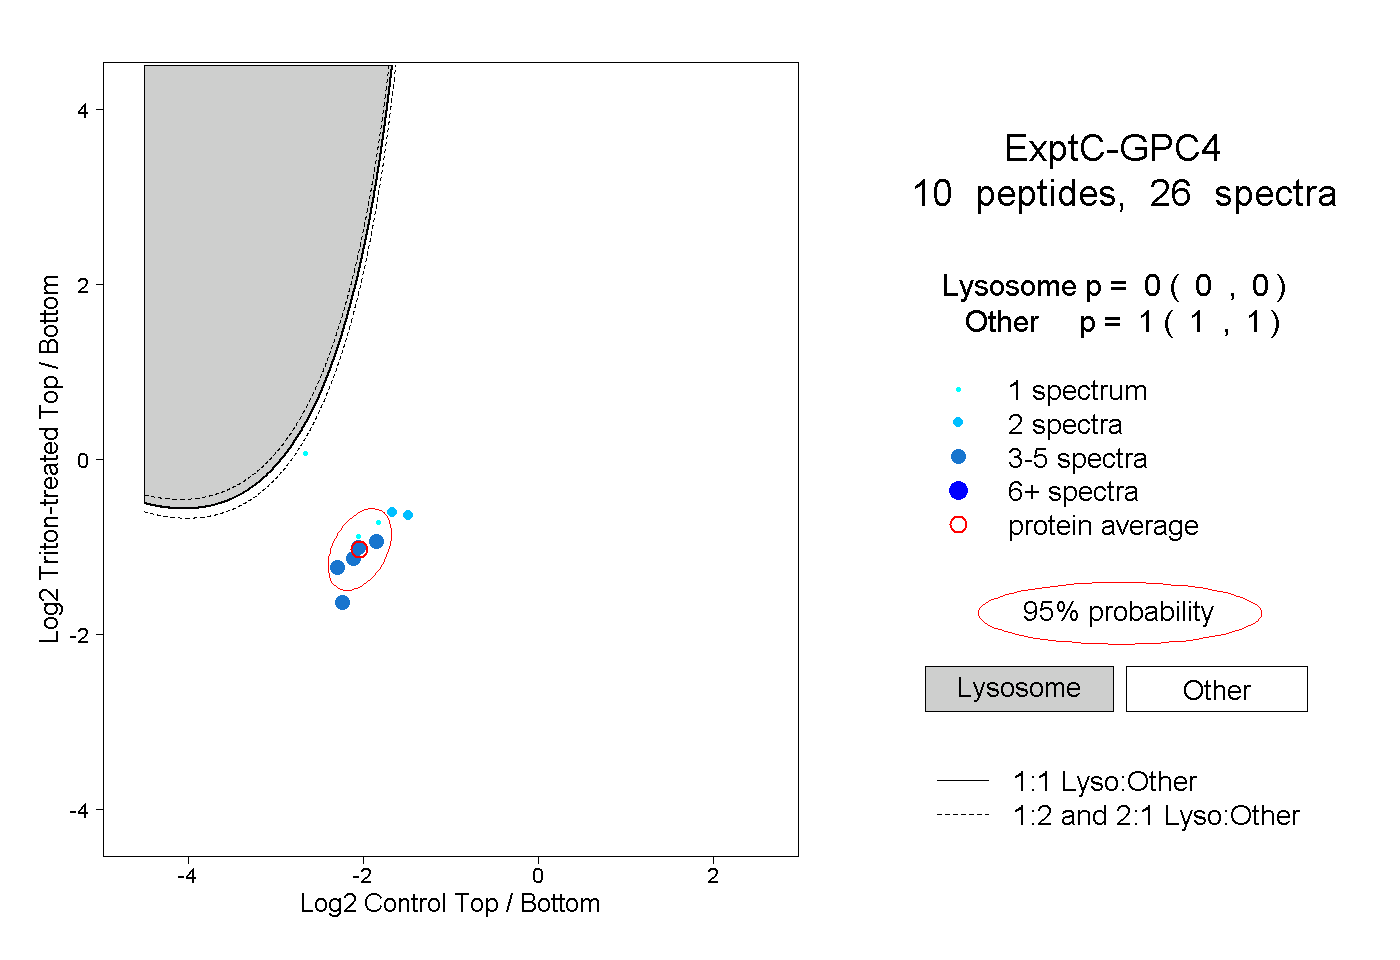
0.000 | 0.000
1.000 | 1.000
3peptides
spectra
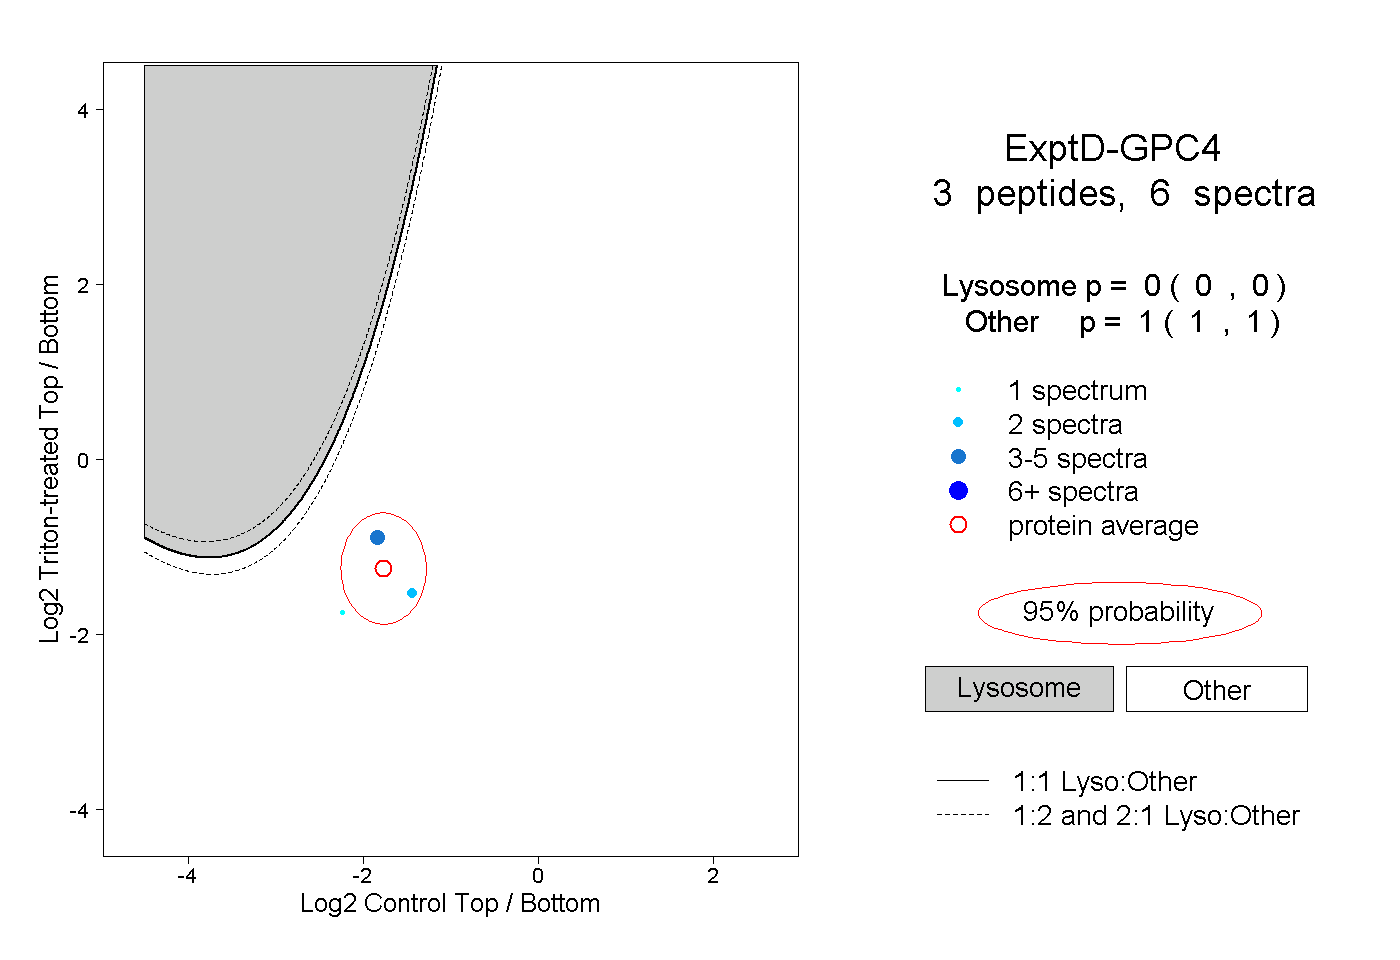
0.000 | 0.000
1.000 | 1.000