 16
16peptides
spectra
0.000 | 0.000
0.000 | 0.000
0.016 | 0.039
0.000 | 0.022
0.000 | 0.031
0.626 | 0.681
0.288 | 0.304
0.000 | 0.000
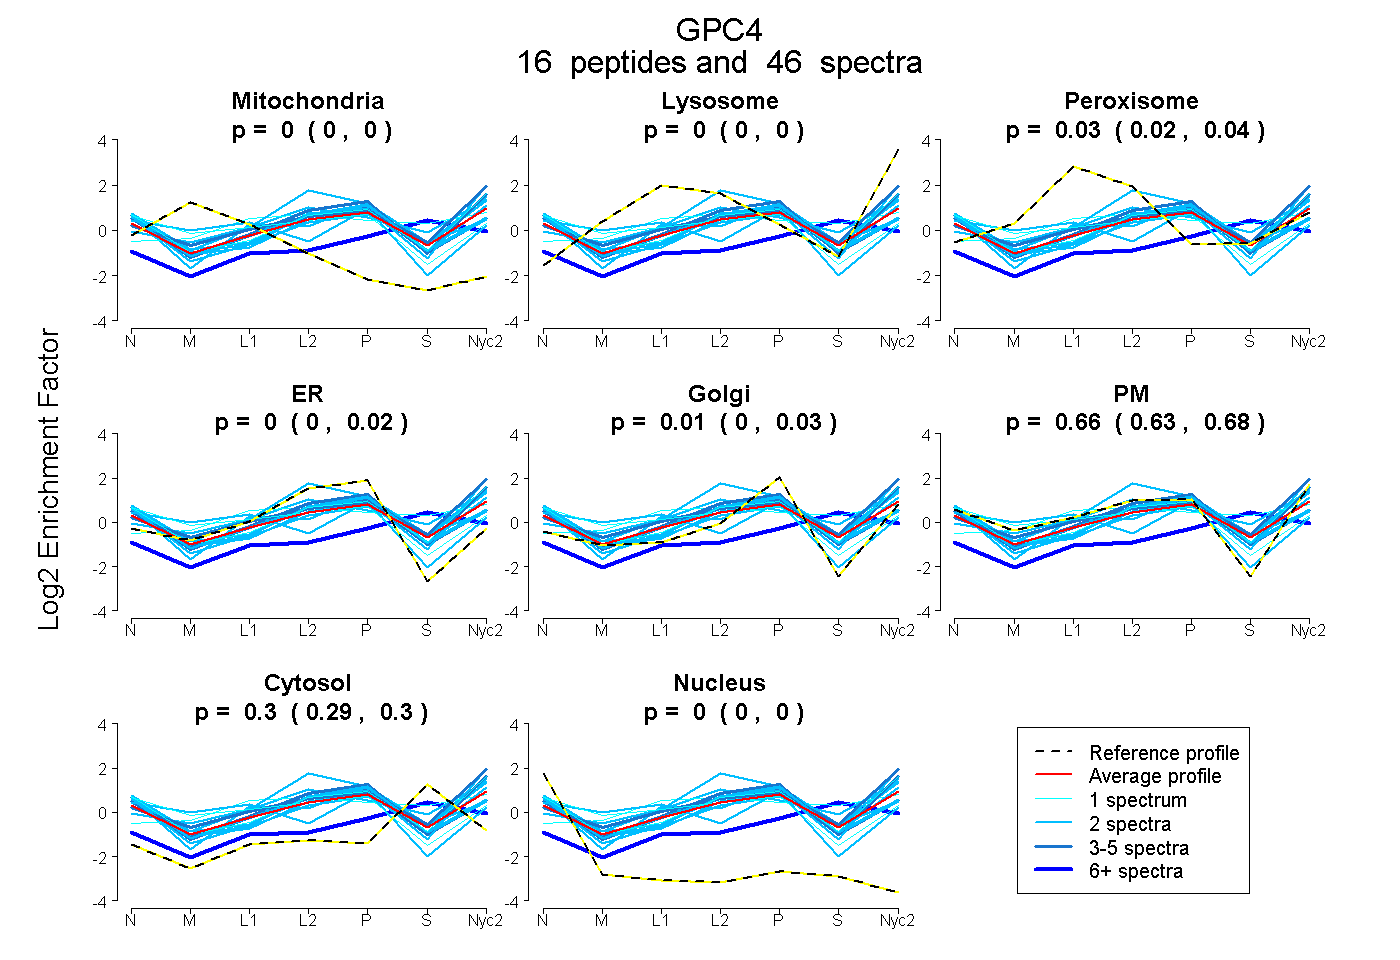
| Plot | Mito | Lyso | Perox | ER | Golgi | PM | Cytosol | Nucleus | |||||
| Expt A |
16 peptides |
46 spectra |
|
0.000 0.000 | 0.000 |
0.000 0.000 | 0.000 |
0.027 0.016 | 0.039 |
0.005 0.000 | 0.022 |
0.005 0.000 | 0.031 |
0.665 0.626 | 0.681 |
0.298 0.288 | 0.304 |
0.000 0.000 | 0.000 |
| 1 spectrum, VSVVNPTAQCTQALLK | 0.098 | 0.000 | 0.093 | 0.137 | 0.000 | 0.542 | 0.093 | 0.038 | ||
| 2 spectra, DLFVELK | 0.000 | 0.000 | 0.000 | 0.000 | 0.000 | 0.715 | 0.285 | 0.000 | ||
| 3 spectra, SLNDMFVK | 0.000 | 0.211 | 0.000 | 0.000 | 0.000 | 0.570 | 0.218 | 0.000 | ||
| 3 spectra, DDFQTVVSEQCNHLQAIFASR | 0.000 | 0.000 | 0.000 | 0.191 | 0.000 | 0.550 | 0.258 | 0.000 | ||
| 2 spectra, VFQGCGPPKPLPAGR | 0.000 | 0.000 | 0.000 | 0.196 | 0.056 | 0.484 | 0.264 | 0.000 | ||
| 2 spectra, EIIENAEK | 0.000 | 0.000 | 0.000 | 0.000 | 0.000 | 0.707 | 0.293 | 0.000 | ||
| 16 spectra, AFVAAR | 0.000 | 0.040 | 0.000 | 0.000 | 0.209 | 0.054 | 0.697 | 0.000 | ||
| 2 spectra, FDEFFK | 0.000 | 0.000 | 0.000 | 0.000 | 0.000 | 0.847 | 0.153 | 0.000 | ||
| 1 spectrum, MAAGNENEDDCWNGK | 0.000 | 0.143 | 0.361 | 0.000 | 0.194 | 0.019 | 0.284 | 0.000 | ||
| 2 spectra, LEGPFNIESVMDPIDVK | 0.000 | 0.115 | 0.134 | 0.000 | 0.000 | 0.483 | 0.269 | 0.000 | ||
| 2 spectra, SISESAFSAR | 0.248 | 0.000 | 0.078 | 0.000 | 0.415 | 0.254 | 0.000 | 0.005 | ||
| 3 spectra, QIMALR | 0.000 | 0.030 | 0.000 | 0.000 | 0.051 | 0.746 | 0.173 | 0.000 | ||
| 2 spectra, SCSEVR | 0.000 | 0.000 | 0.000 | 0.020 | 0.015 | 0.734 | 0.231 | 0.000 | ||
| 1 spectrum, YTEQLKPFGDVPR | 0.000 | 0.000 | 0.000 | 0.000 | 0.000 | 0.785 | 0.215 | 0.000 | ||
| 2 spectra, GLVTVKPCYNYCSNIMR | 0.000 | 0.000 | 0.000 | 0.179 | 0.044 | 0.505 | 0.272 | 0.000 | ||
| 2 spectra, MIYCSHCR | 0.000 | 0.061 | 0.207 | 0.436 | 0.000 | 0.143 | 0.154 | 0.000 |
| Plot | Mito | Lyso or Perox | ER | Golgi | PM | Cytosol | Nucleus | ||||||
| Expt B |
2 peptides |
5 spectra |
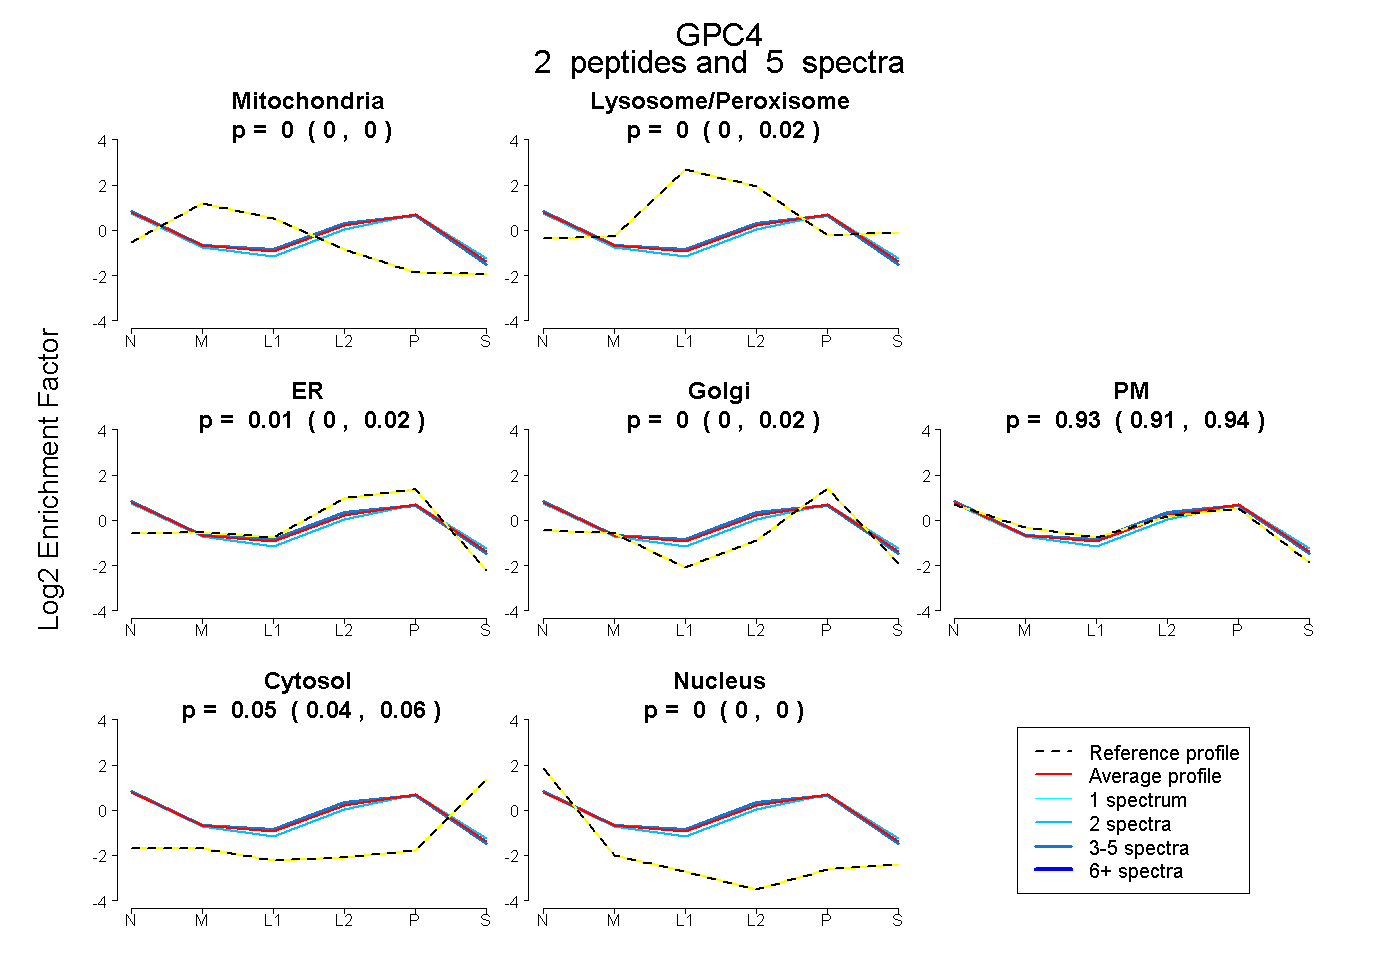 |
0.000 0.000 | 0.000 |
0.002 0.000 | 0.017 |
0.010 0.000 | 0.024 |
0.000 0.000 | 0.022 |
0.934 0.912 | 0.940 |
0.053 0.044 | 0.059 |
0.000 0.000 | 0.000 |
|||
| Plot | Lyso | Other | |||||||||||
| Expt C |
10 peptides |
26 spectra |
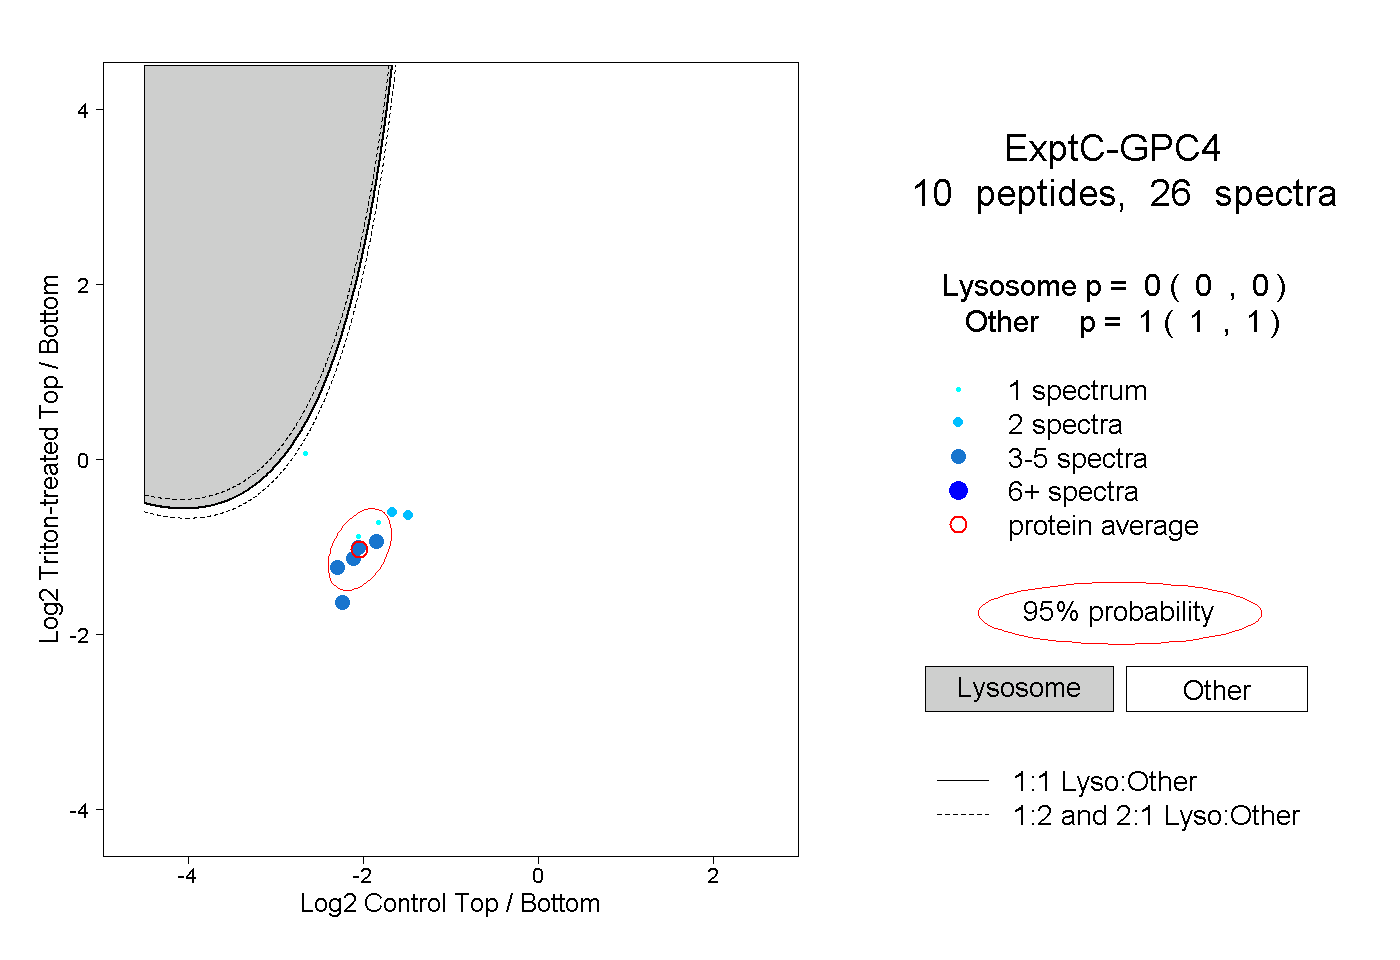 |
0.000 0.000 | 0.000 |
1.000 1.000 | 1.000 |
||||||||
| Plot | Lyso | Other | |||||||||||
| Expt D |
3 peptides |
6 spectra |
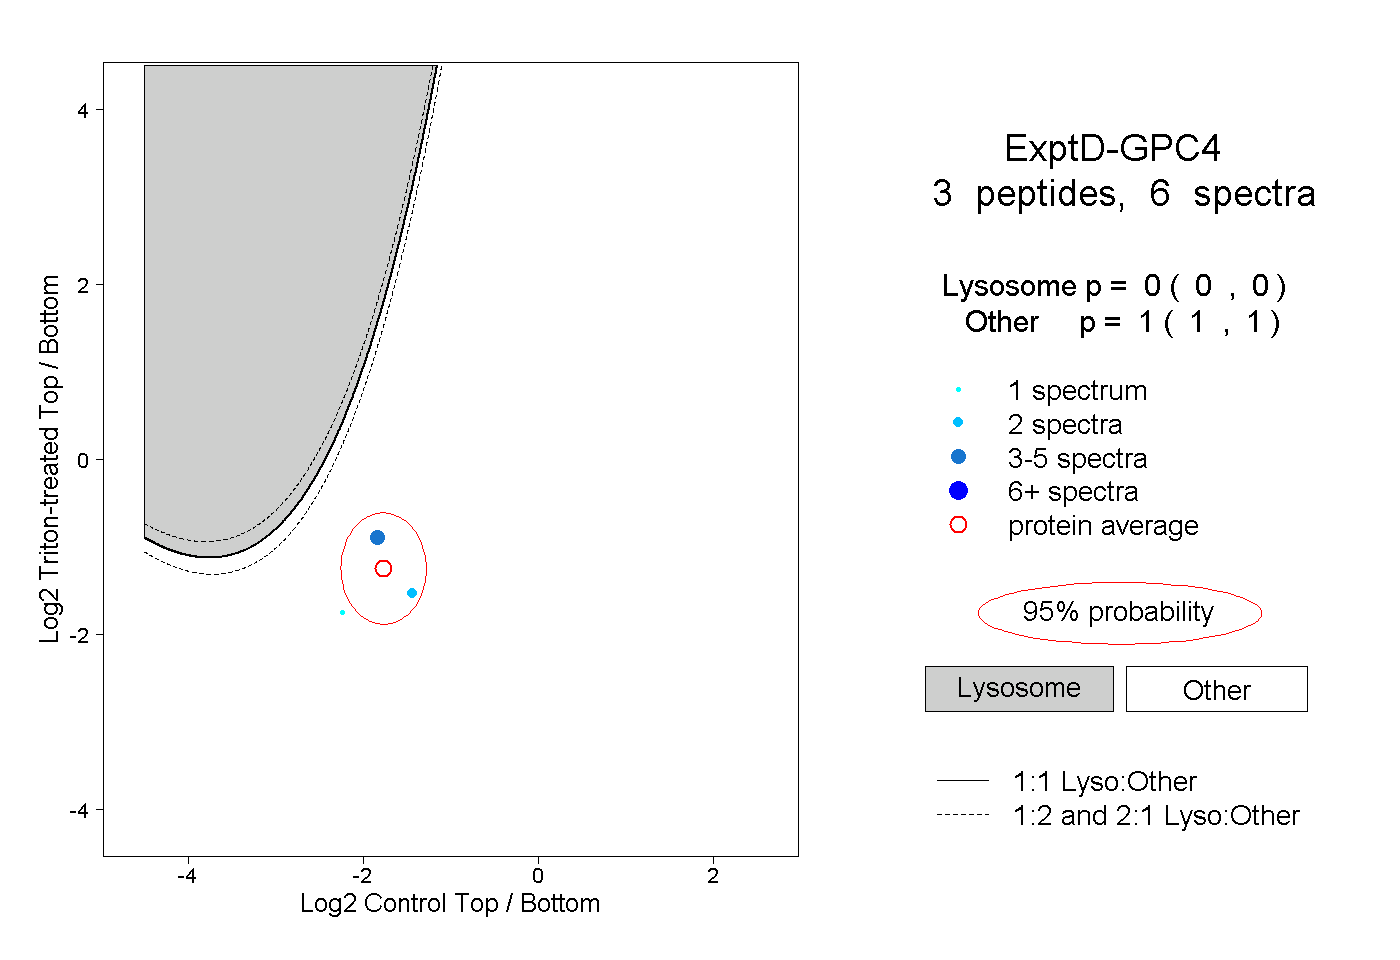 |
0.000 0.000 | 0.000 |
1.000 1.000 | 1.000 |