 4
4peptides
spectra
0.000 | 0.010
0.000 | 0.000
0.000 | 0.000
0.389 | 0.467
0.000 | 0.000
0.000 | 0.000
0.328 | 0.430
0.133 | 0.224
2peptides
spectra
NA | NA
NA | NA
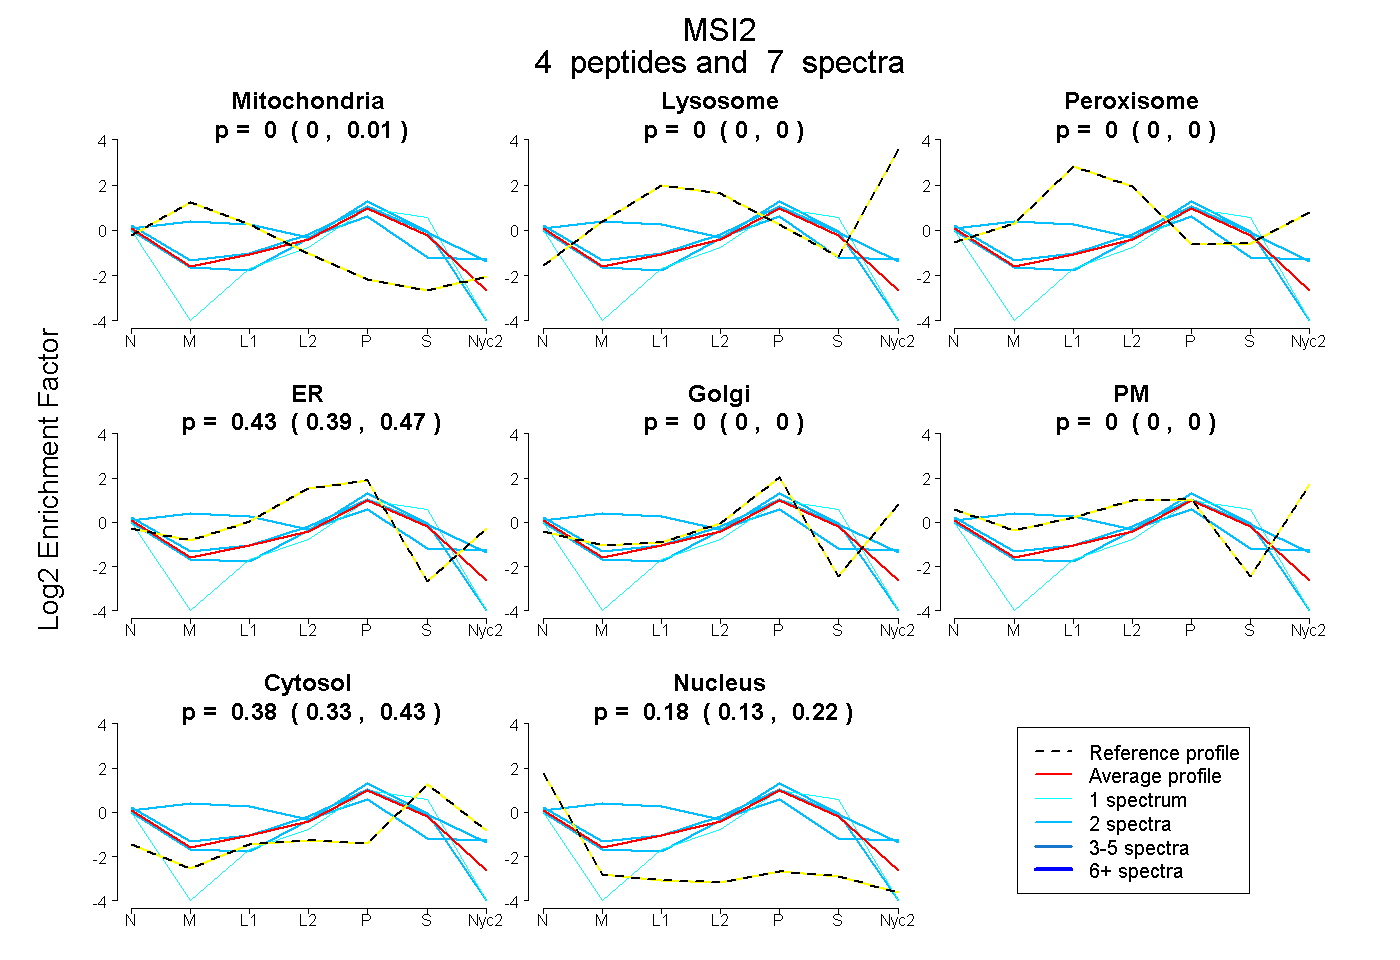
| Plot | Mito | Lyso | Perox | ER | Golgi | PM | Cytosol | Nucleus | |||||
| Expt A |
4 peptides |
7 spectra |
|
0.000 0.000 | 0.010 |
0.000 0.000 | 0.000 |
0.000 0.000 | 0.000 |
0.434 0.389 | 0.467 |
0.000 0.000 | 0.000 |
0.000 0.000 | 0.000 |
0.383 0.328 | 0.430 |
0.182 0.133 | 0.224 |
||
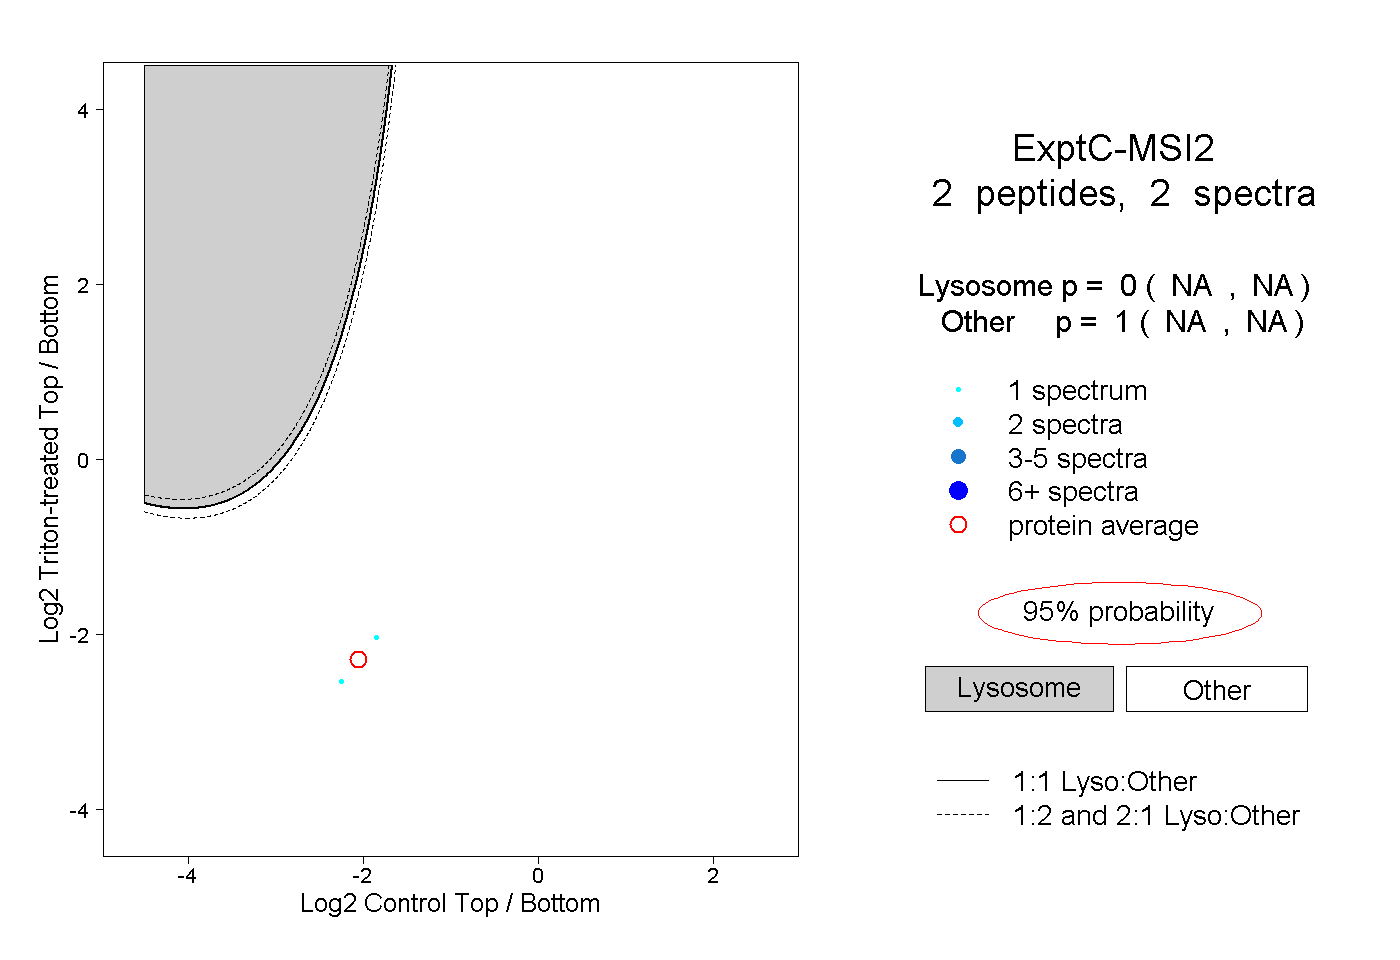
| Plot | Lyso | Other | |||||||||||
| Expt C |
2 peptides |
2 spectra |
|
0.000 NA | NA |
1.000 NA | NA |