 4
4peptides
spectra
0.000 | 0.010
0.000 | 0.000
0.000 | 0.000
0.389 | 0.467
0.000 | 0.000
0.000 | 0.000
0.328 | 0.430
0.133 | 0.224
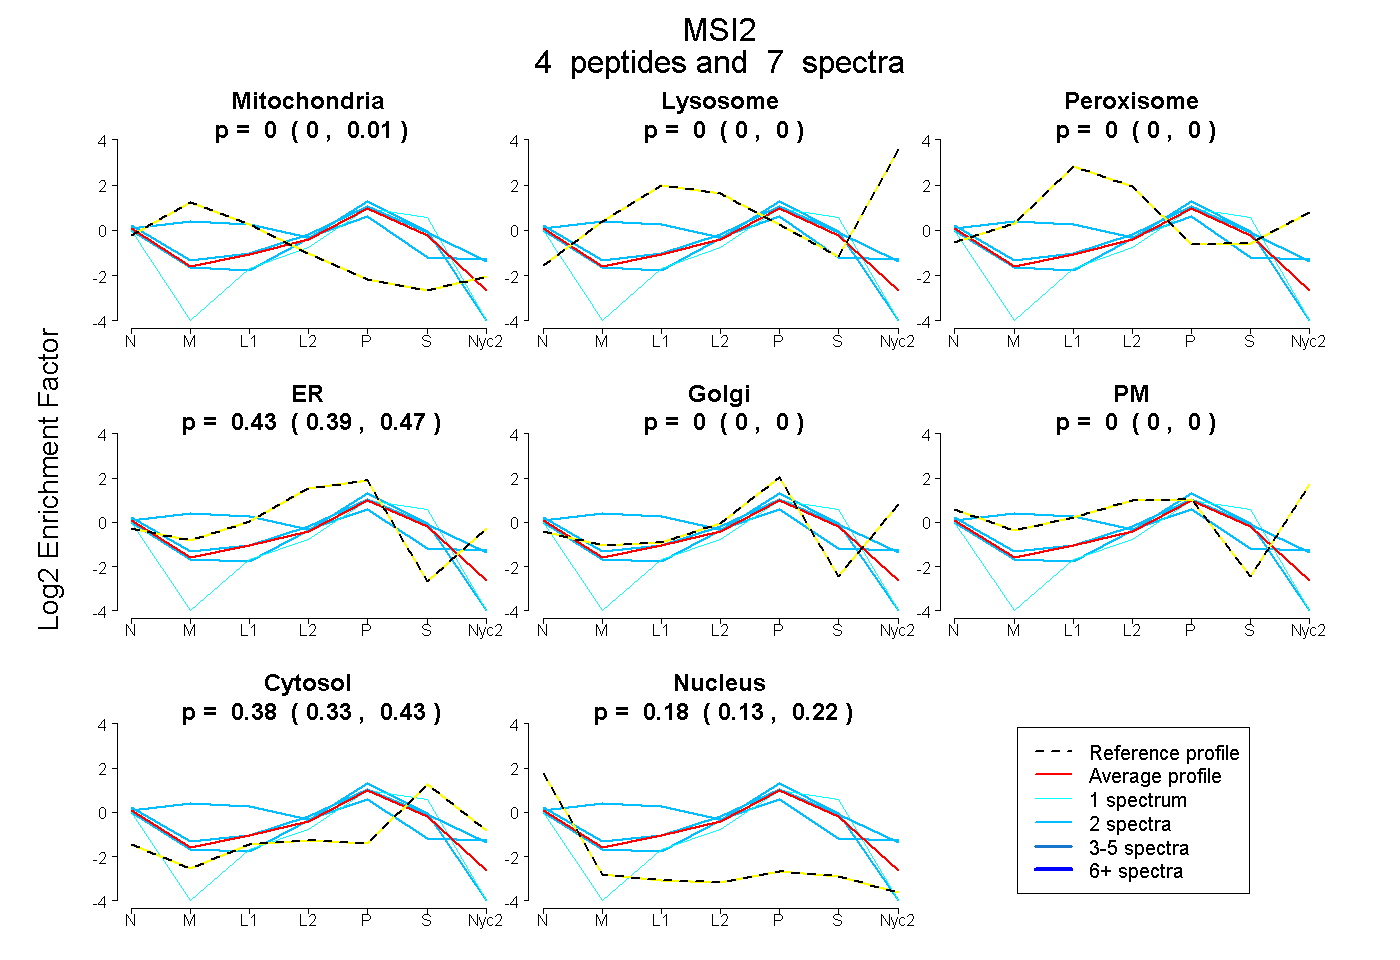
| Plot | Mito | Lyso | Perox | ER | Golgi | PM | Cytosol | Nucleus | |||||
| Expt A |
4 peptides |
7 spectra |
|
0.000 0.000 | 0.010 |
0.000 0.000 | 0.000 |
0.000 0.000 | 0.000 |
0.434 0.389 | 0.467 |
0.000 0.000 | 0.000 |
0.000 0.000 | 0.000 |
0.383 0.328 | 0.430 |
0.182 0.133 | 0.224 |
| 2 spectra, VLGQPHHELDSK | 0.000 | 0.000 | 0.000 | 0.491 | 0.000 | 0.000 | 0.433 | 0.077 | ||
| 1 spectrum, VEDAMLMFDK | 0.000 | 0.000 | 0.000 | 0.175 | 0.000 | 0.000 | 0.544 | 0.281 | ||
| 2 spectra, VAFPR | 0.370 | 0.000 | 0.087 | 0.298 | 0.125 | 0.000 | 0.119 | 0.000 | ||
| 2 spectra, VCEIHFHEINNK | 0.000 | 0.000 | 0.000 | 0.387 | 0.000 | 0.000 | 0.341 | 0.272 |
| Plot | Lyso | Other | |||||||||||
| Expt C |
2 peptides |
2 spectra |
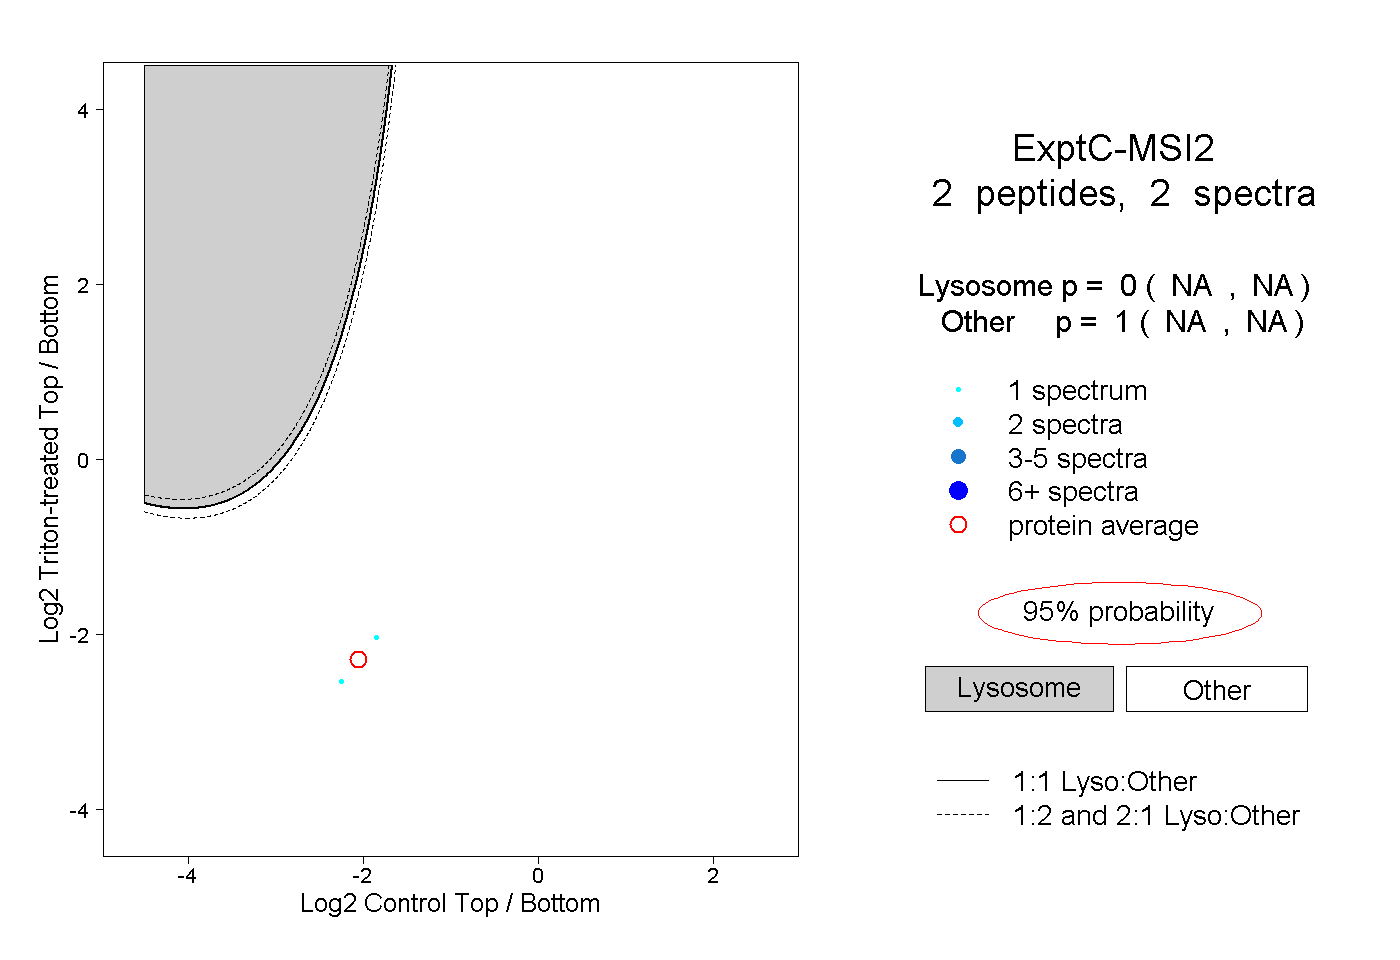 |
0.000 NA | NA |
1.000 NA | NA |