 8
8peptides
spectra
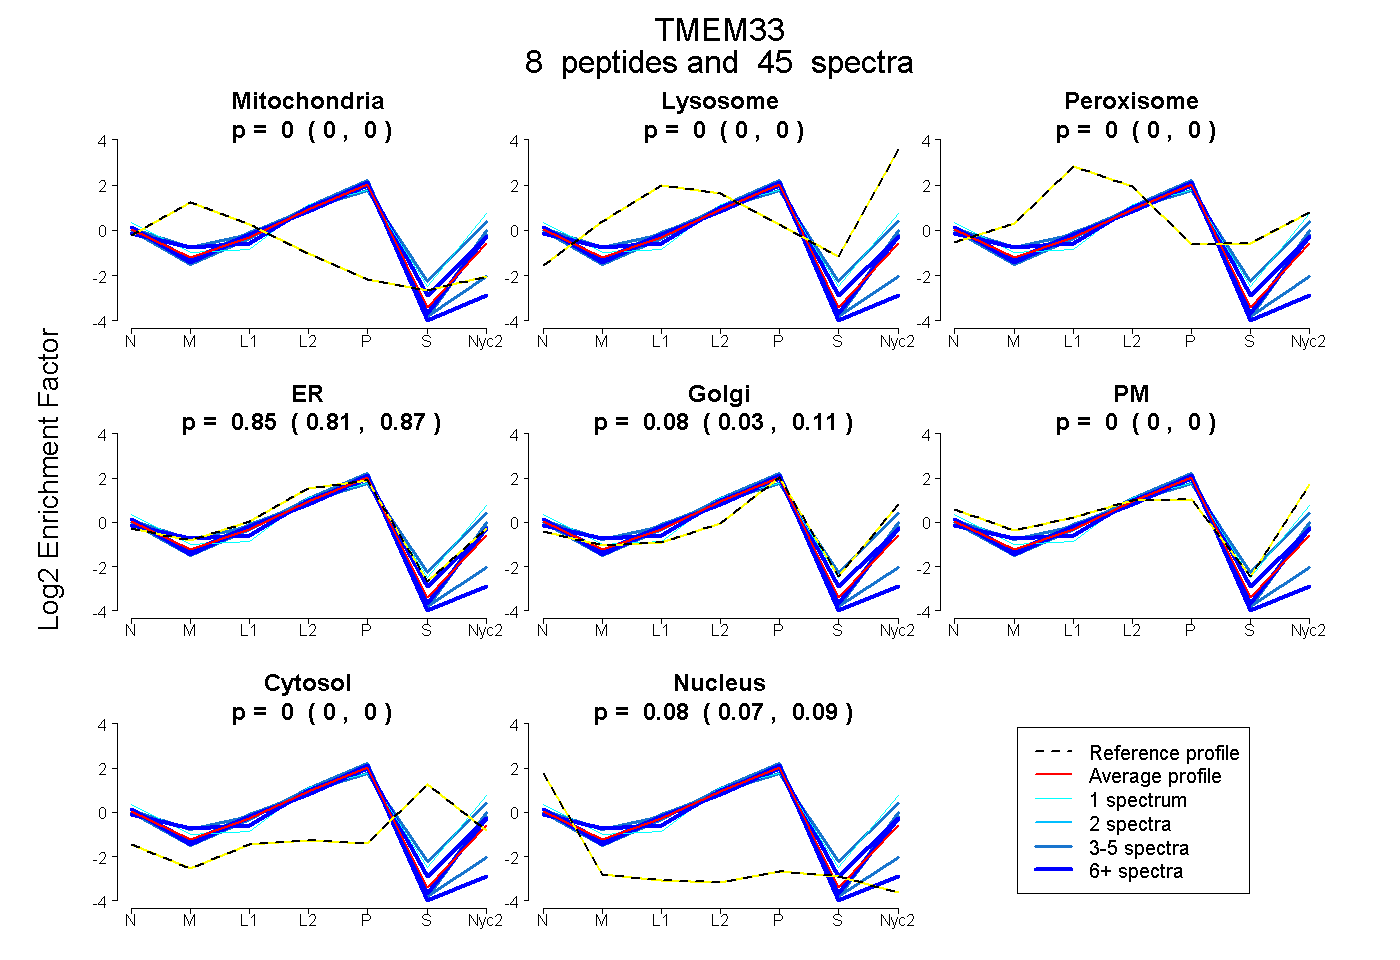
0.000 | 0.000
0.000 | 0.000
0.000 | 0.000
0.813 | 0.873
0.033 | 0.112
0.000 | 0.000
0.000 | 0.000
0.069 | 0.087
6peptides
spectra
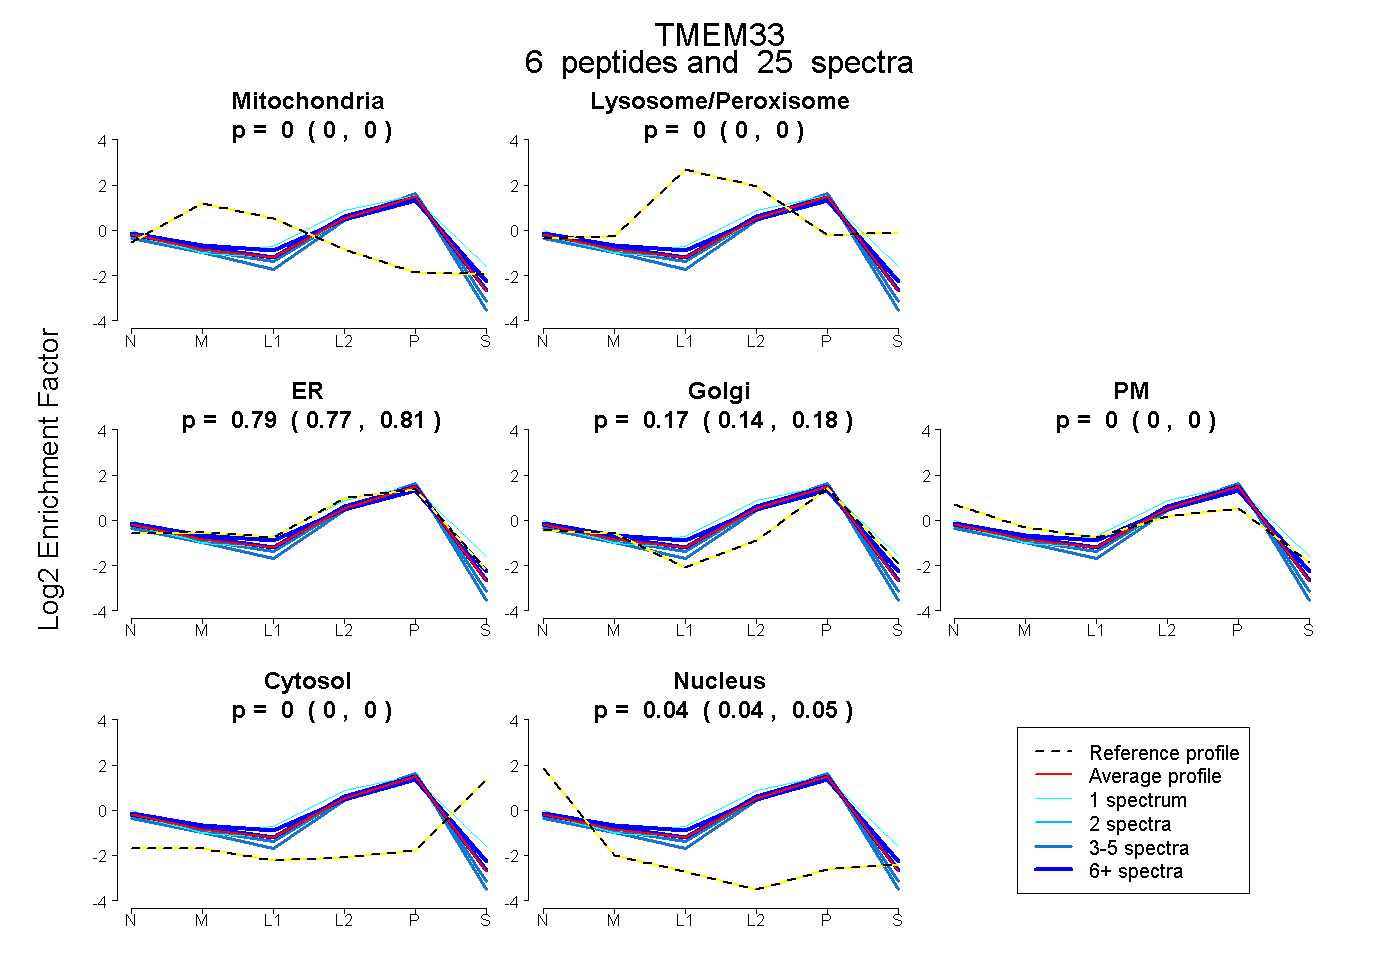
0.000 | 0.000
0.000 | 0.000
0.773 | 0.808
0.141 | 0.184
0.000 | 0.000
0.000 | 0.000
0.037 | 0.047
7peptides
spectra
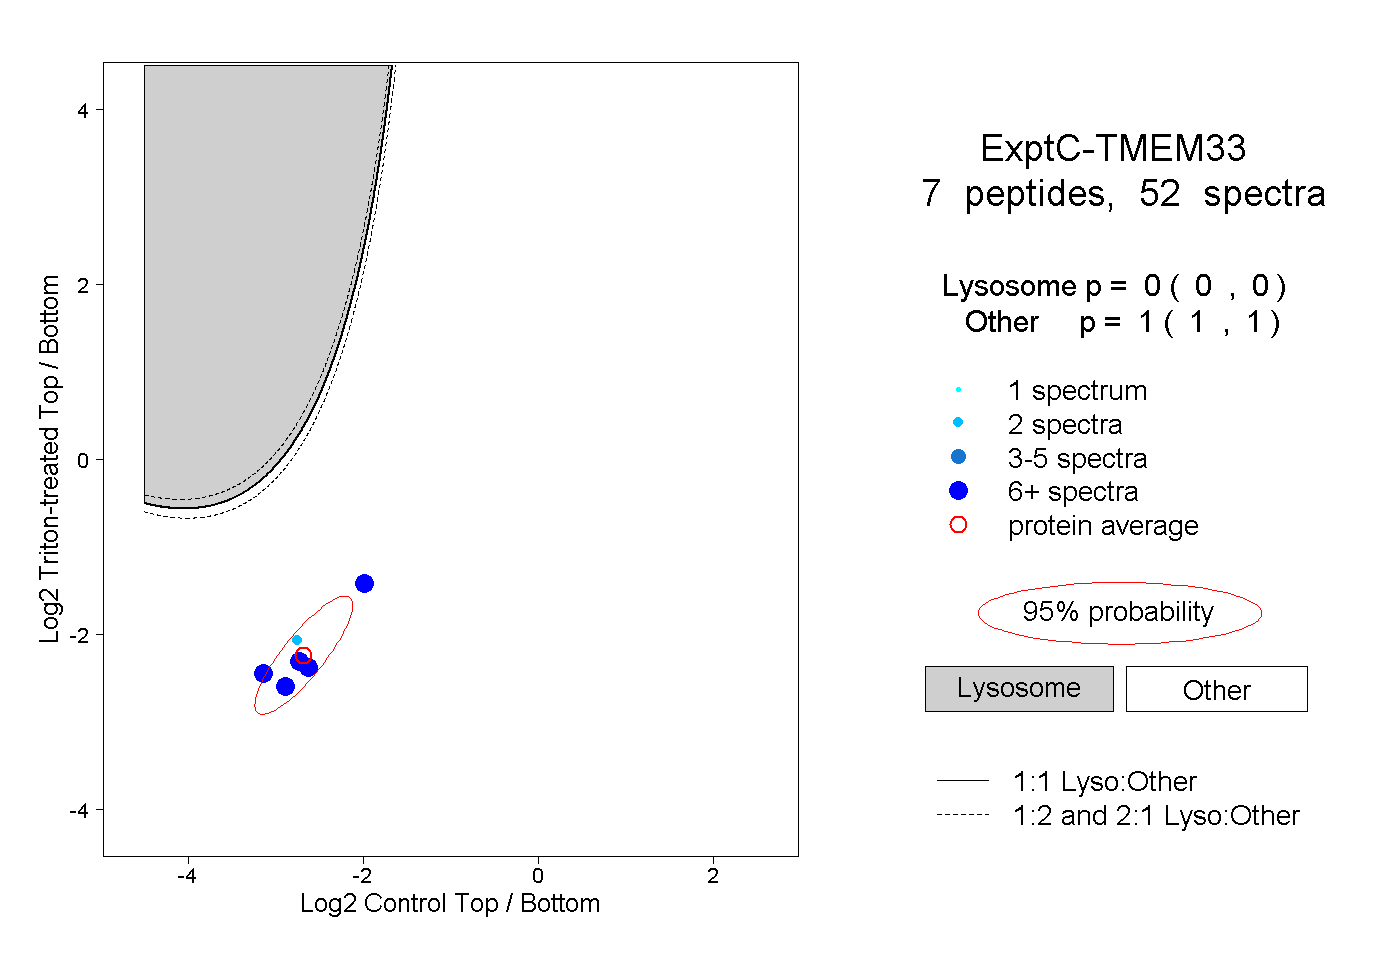
0.000 | 0.000
1.000 | 1.000
5peptides
spectra
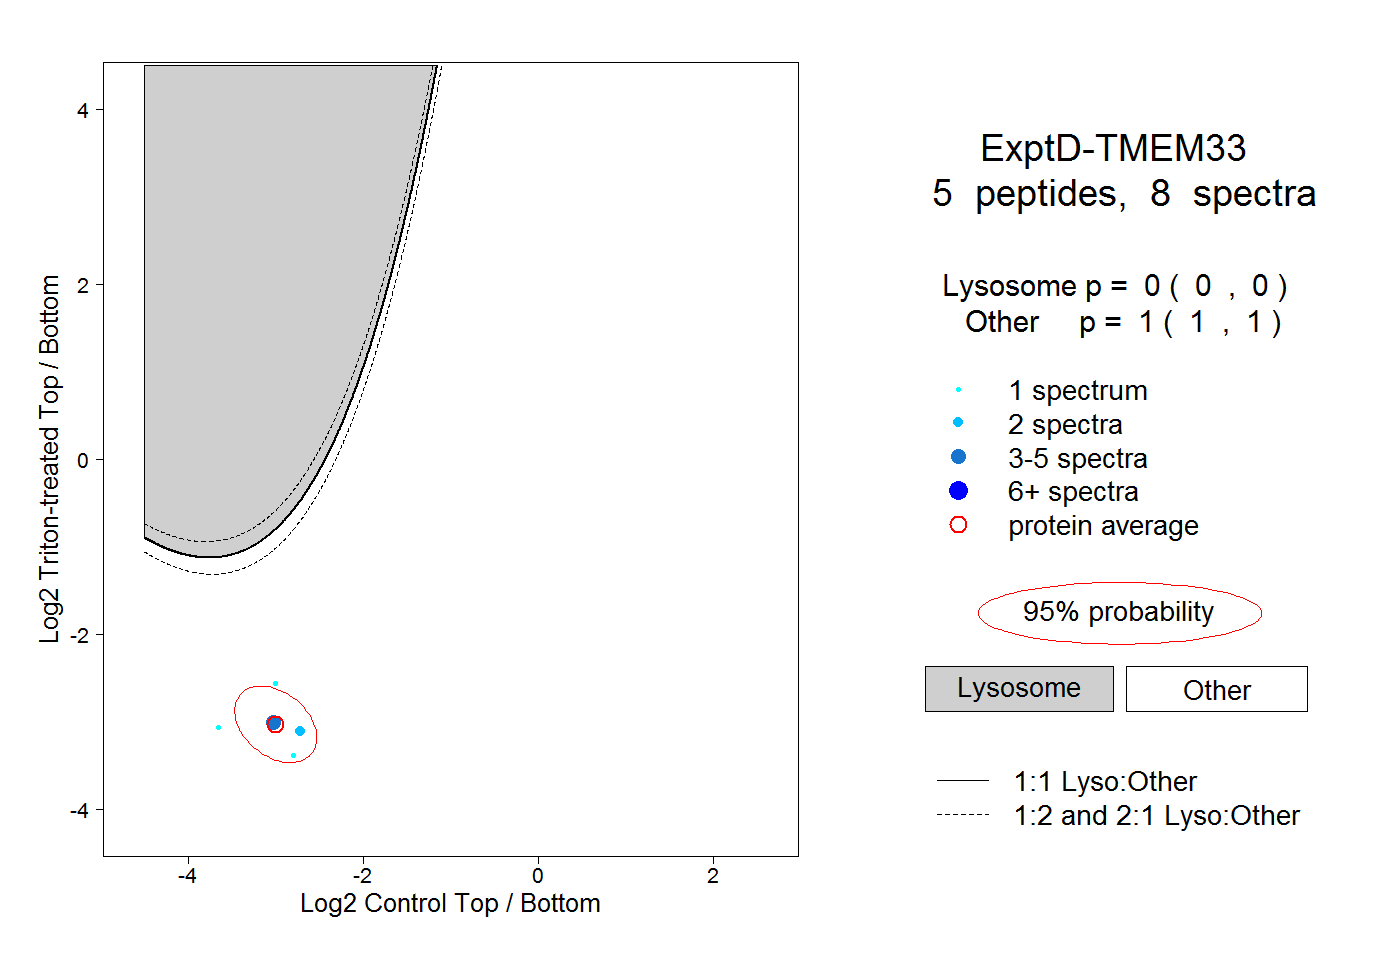
0.000 | 0.000
1.000 | 1.000