 8
8peptides
spectra
0.000 | 0.000
0.000 | 0.000
0.000 | 0.000
0.813 | 0.873
0.033 | 0.112
0.000 | 0.000
0.000 | 0.000
0.069 | 0.087
| Plot | Mito | Lyso | Perox | ER | Golgi | PM | Cytosol | Nucleus | |||||
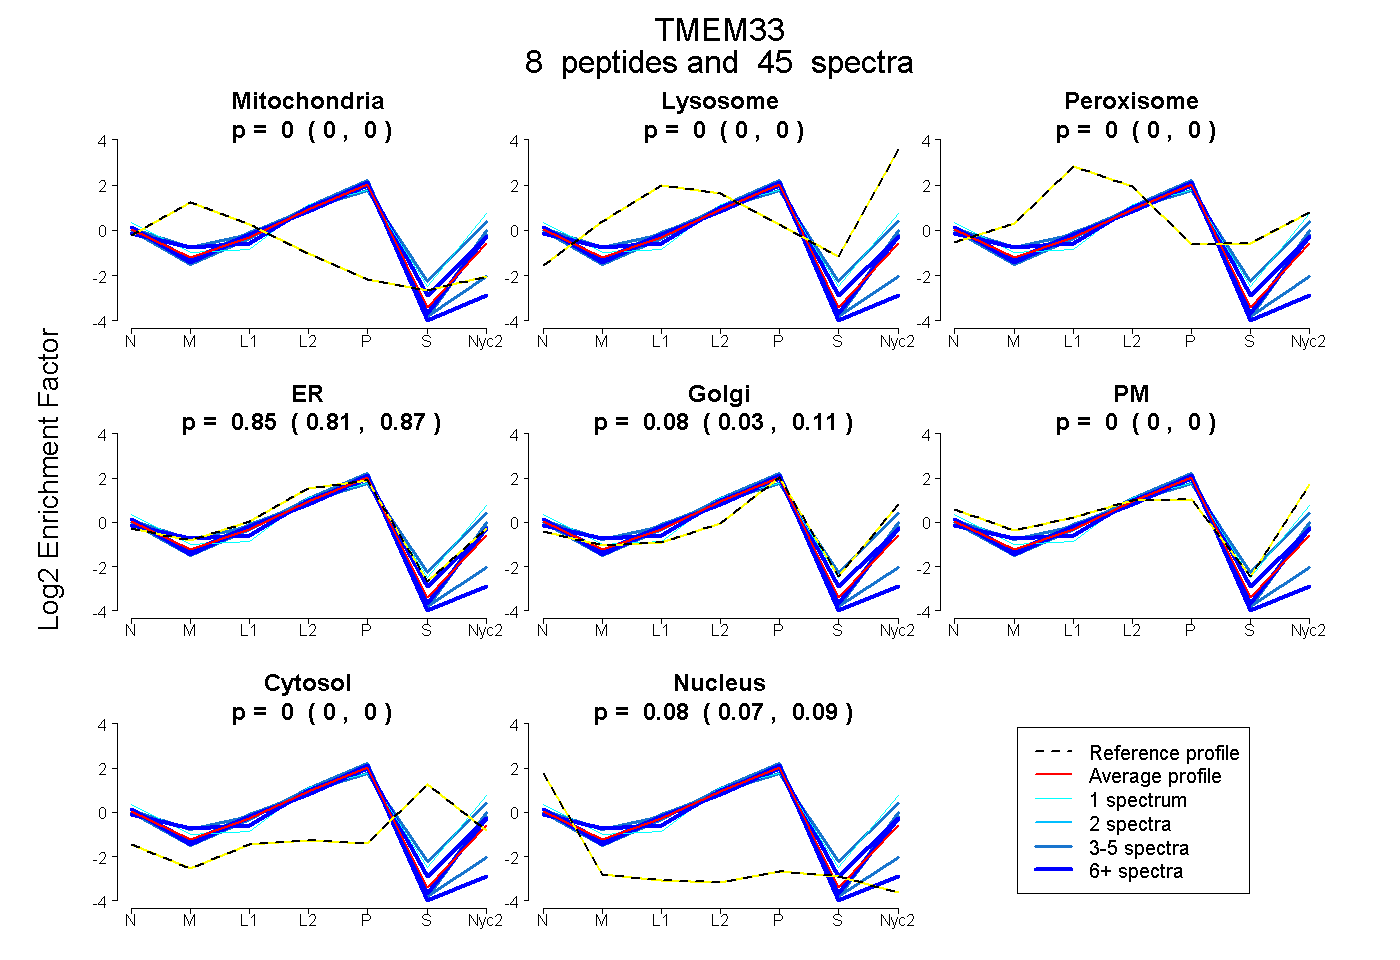
| Expt A |
8 peptides |
45 spectra |
|
0.000 0.000 | 0.000 |
0.000 0.000 | 0.000 |
0.000 0.000 | 0.000 |
0.846 0.813 | 0.873 |
0.075 0.033 | 0.112 |
0.000 0.000 | 0.000 |
0.000 0.000 | 0.000 |
0.079 0.069 | 0.087 |
| 6 spectra, NLFNELR | 0.000 | 0.000 | 0.000 | 0.754 | 0.199 | 0.000 | 0.000 | 0.047 | ||
| 3 spectra, GSNSLPLLR | 0.000 | 0.000 | 0.000 | 0.733 | 0.242 | 0.000 | 0.000 | 0.025 | ||
| 5 spectra, IVVEHIIMKPSCPLFVR | 0.000 | 0.000 | 0.000 | 0.855 | 0.000 | 0.000 | 0.000 | 0.145 | ||
| 15 spectra, LPHFQLSR | 0.000 | 0.000 | 0.000 | 0.729 | 0.208 | 0.000 | 0.000 | 0.063 | ||
| 7 spectra, LCLQSIAFISR | 0.000 | 0.000 | 0.000 | 0.804 | 0.000 | 0.000 | 0.000 | 0.196 | ||
| 1 spectrum, LSTNQQNILK | 0.000 | 0.000 | 0.000 | 0.328 | 0.361 | 0.295 | 0.000 | 0.016 | ||
| 4 spectra, ALLANALTSALR | 0.000 | 0.000 | 0.000 | 0.778 | 0.182 | 0.000 | 0.000 | 0.040 | ||
| 4 spectra, LDTAMWLSR | 0.000 | 0.000 | 0.000 | 0.495 | 0.219 | 0.252 | 0.034 | 0.000 |
| Plot | Mito | Lyso or Perox | ER | Golgi | PM | Cytosol | Nucleus | ||||||
| Expt B |
6 peptides |
25 spectra |
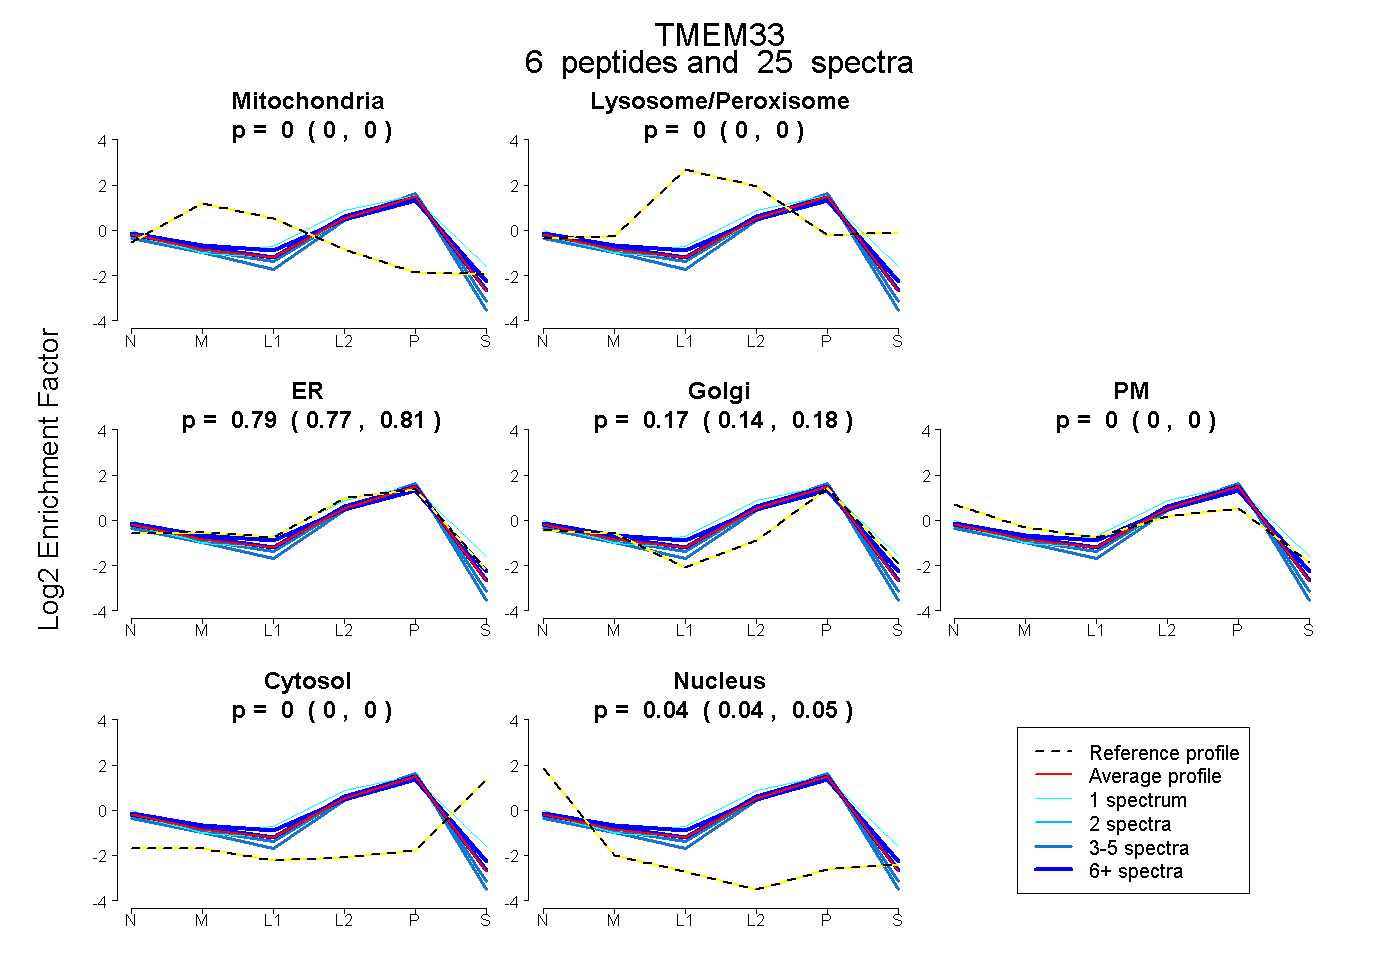 |
0.000 0.000 | 0.000 |
0.000 0.000 | 0.000 |
0.792 0.773 | 0.808 |
0.165 0.141 | 0.184 |
0.000 0.000 | 0.000 |
0.000 0.000 | 0.000 |
0.043 0.037 | 0.047 |
|||
| Plot | Lyso | Other | |||||||||||
| Expt C |
7 peptides |
52 spectra |
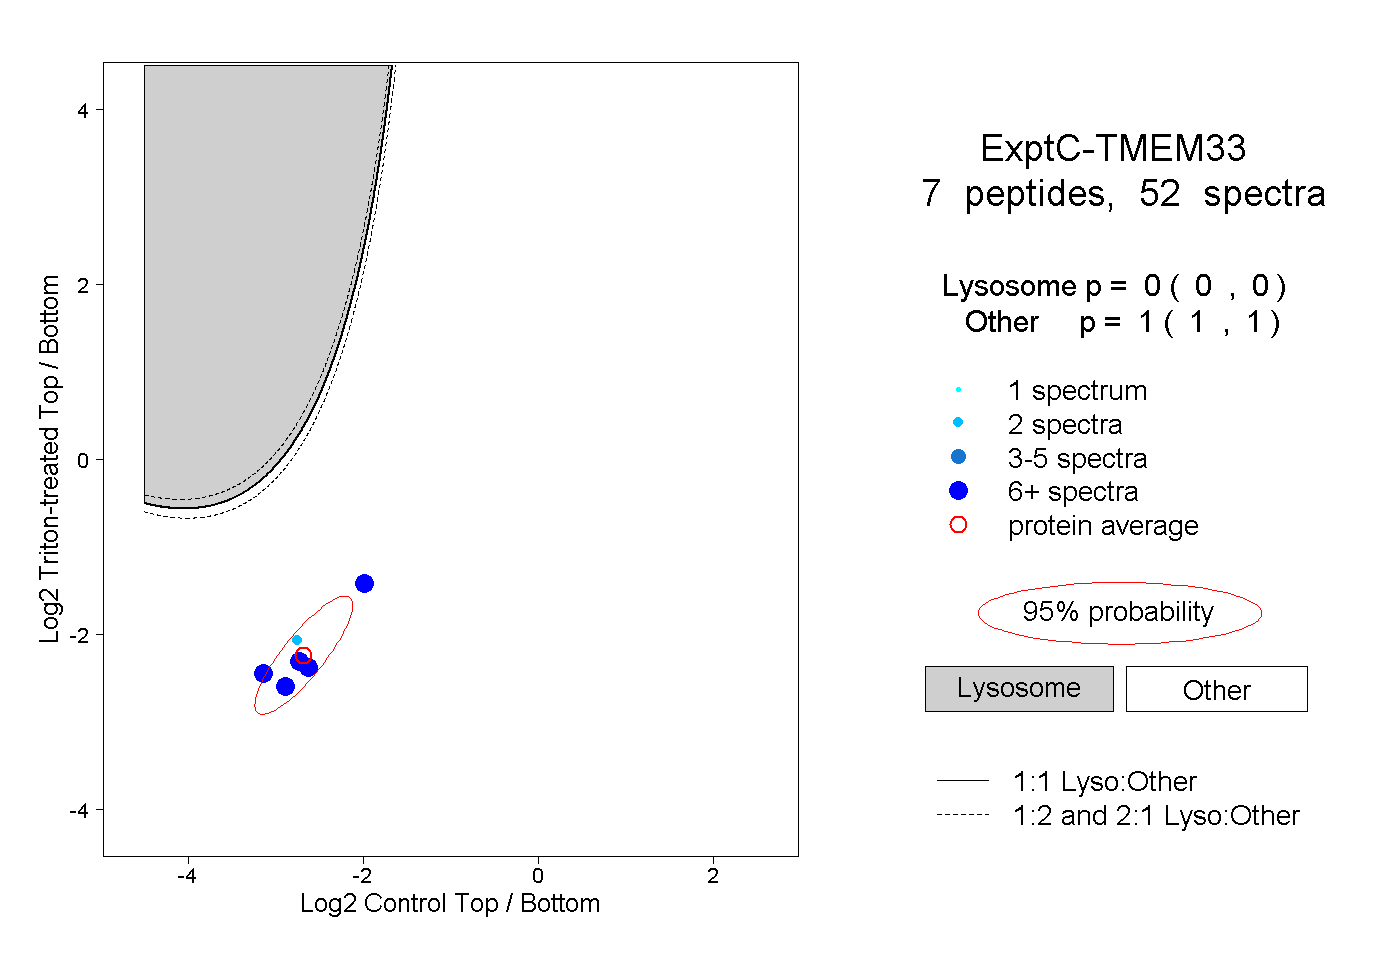 |
0.000 0.000 | 0.000 |
1.000 1.000 | 1.000 |
||||||||
| Plot | Lyso | Other | |||||||||||
| Expt D |
5 peptides |
8 spectra |
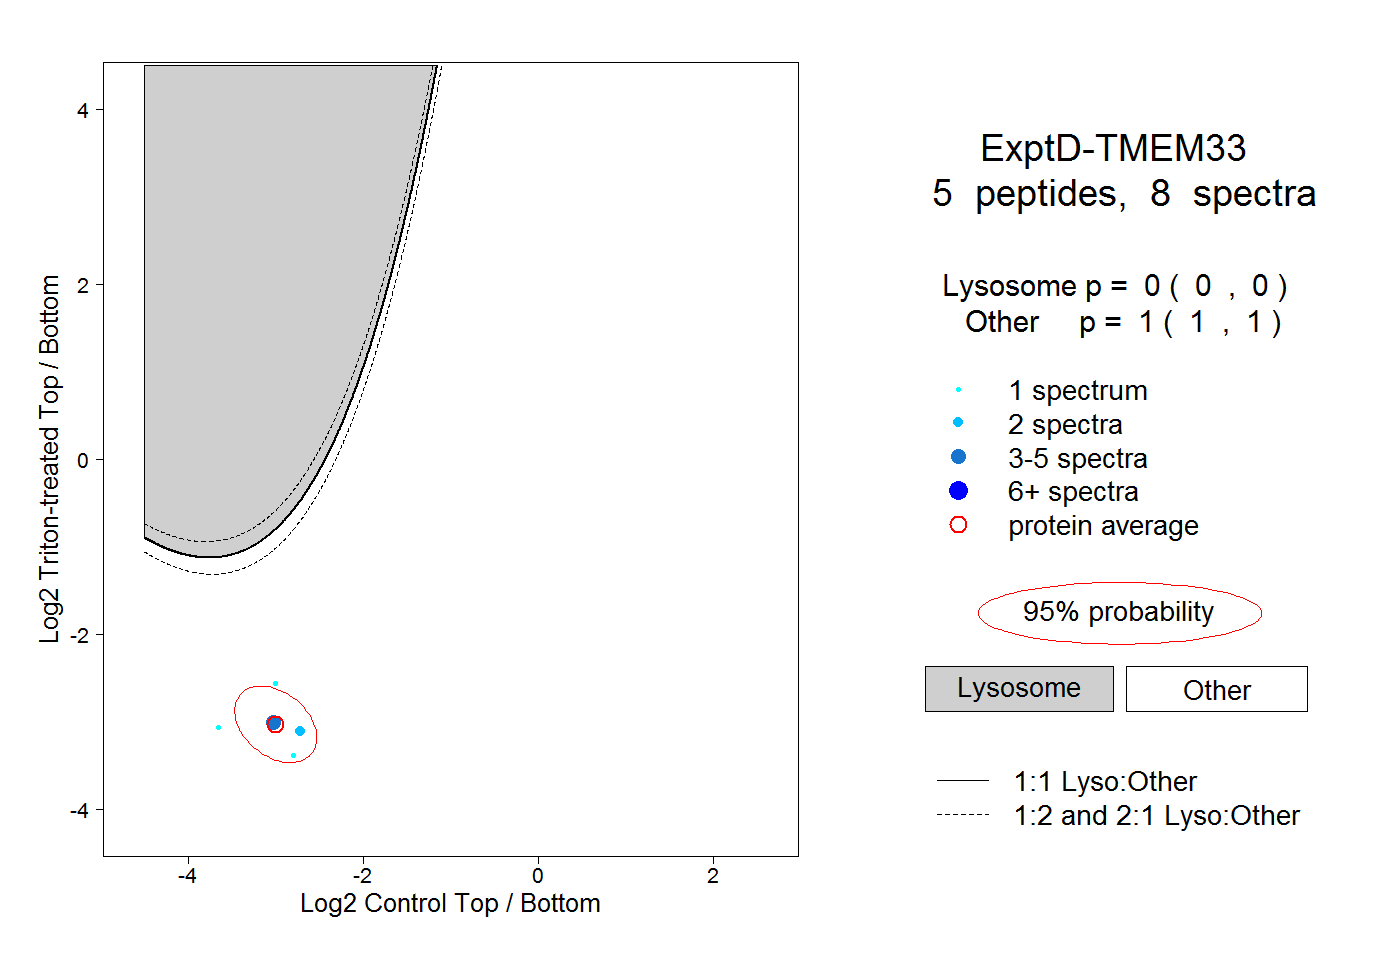 |
0.000 0.000 | 0.000 |
1.000 1.000 | 1.000 |