 31
31peptides
spectra
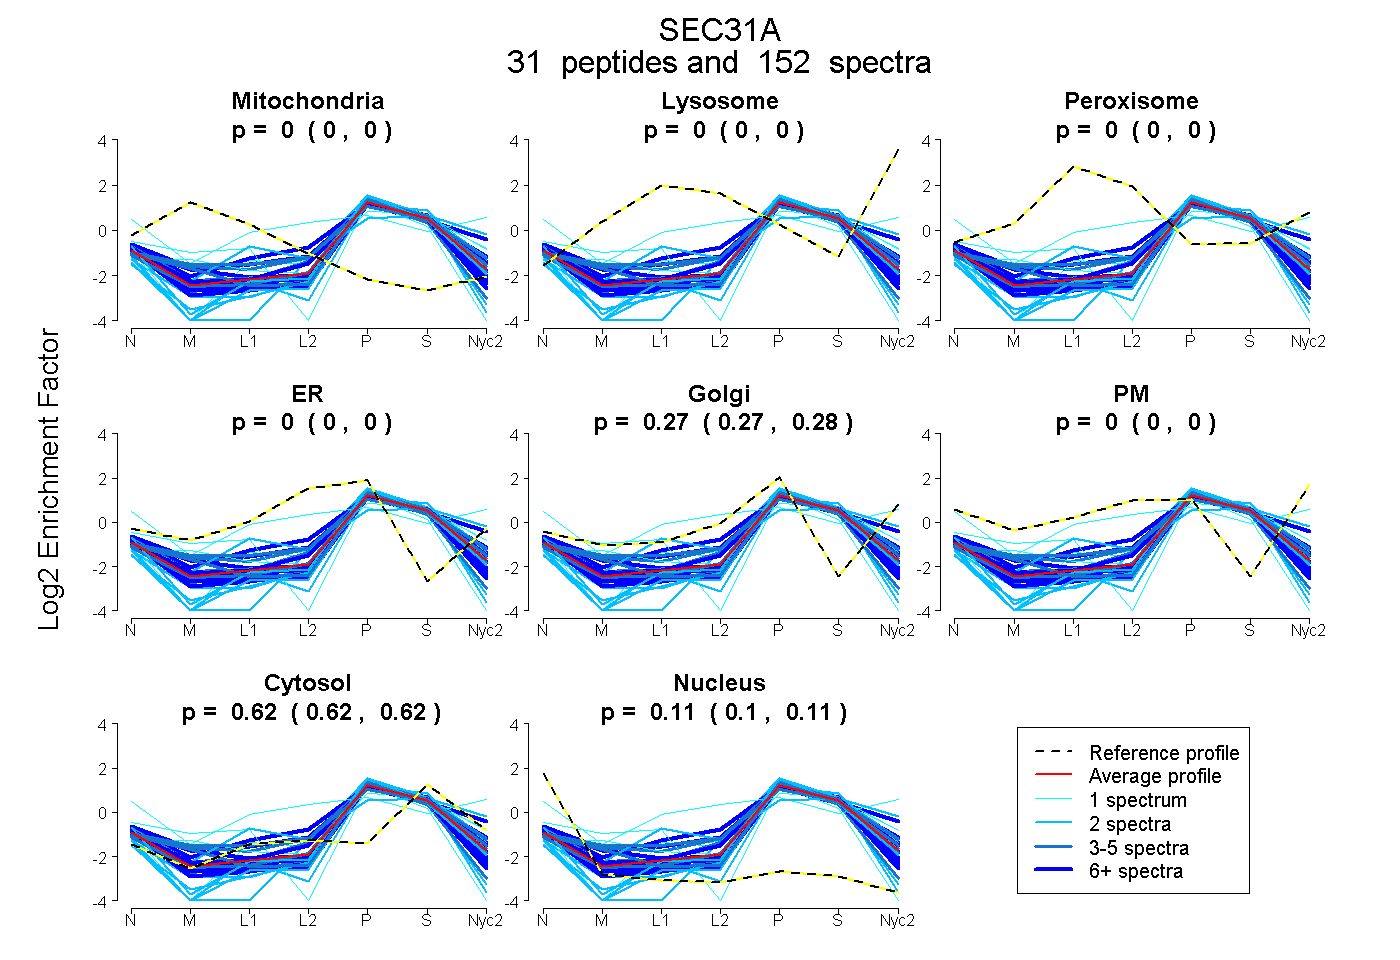
0.000 | 0.000
0.000 | 0.000
0.000 | 0.000
0.000 | 0.000
0.272 | 0.276
0.000 | 0.000
0.618 | 0.620
0.105 | 0.108
23peptides
spectra
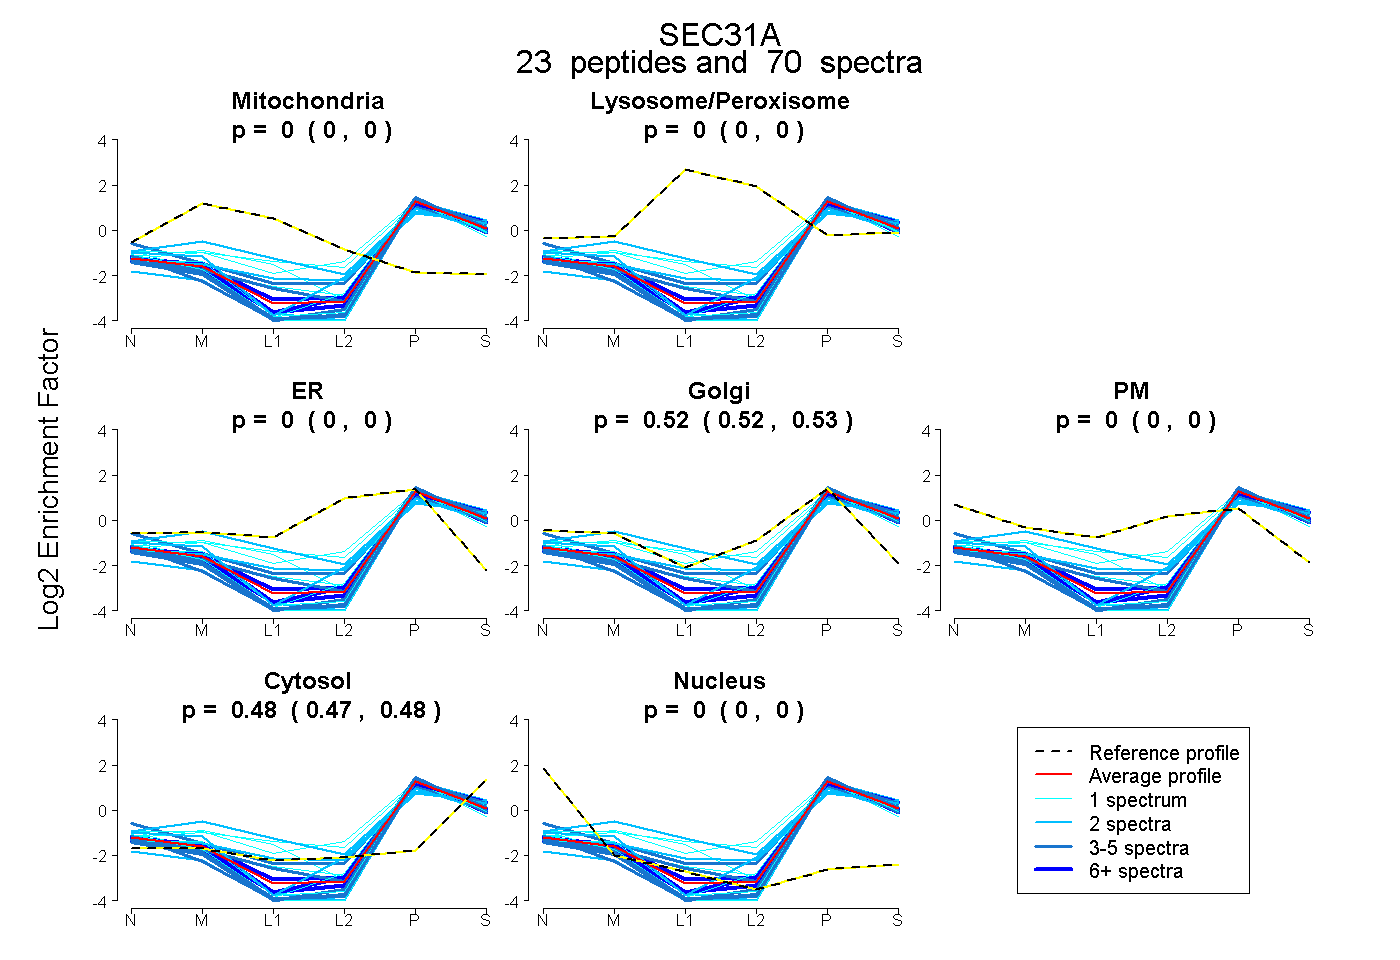
0.000 | 0.000
0.000 | 0.000
0.000 | 0.000
0.521 | 0.526
0.000 | 0.000
0.474 | 0.478
0.000 | 0.000
26peptides
spectra
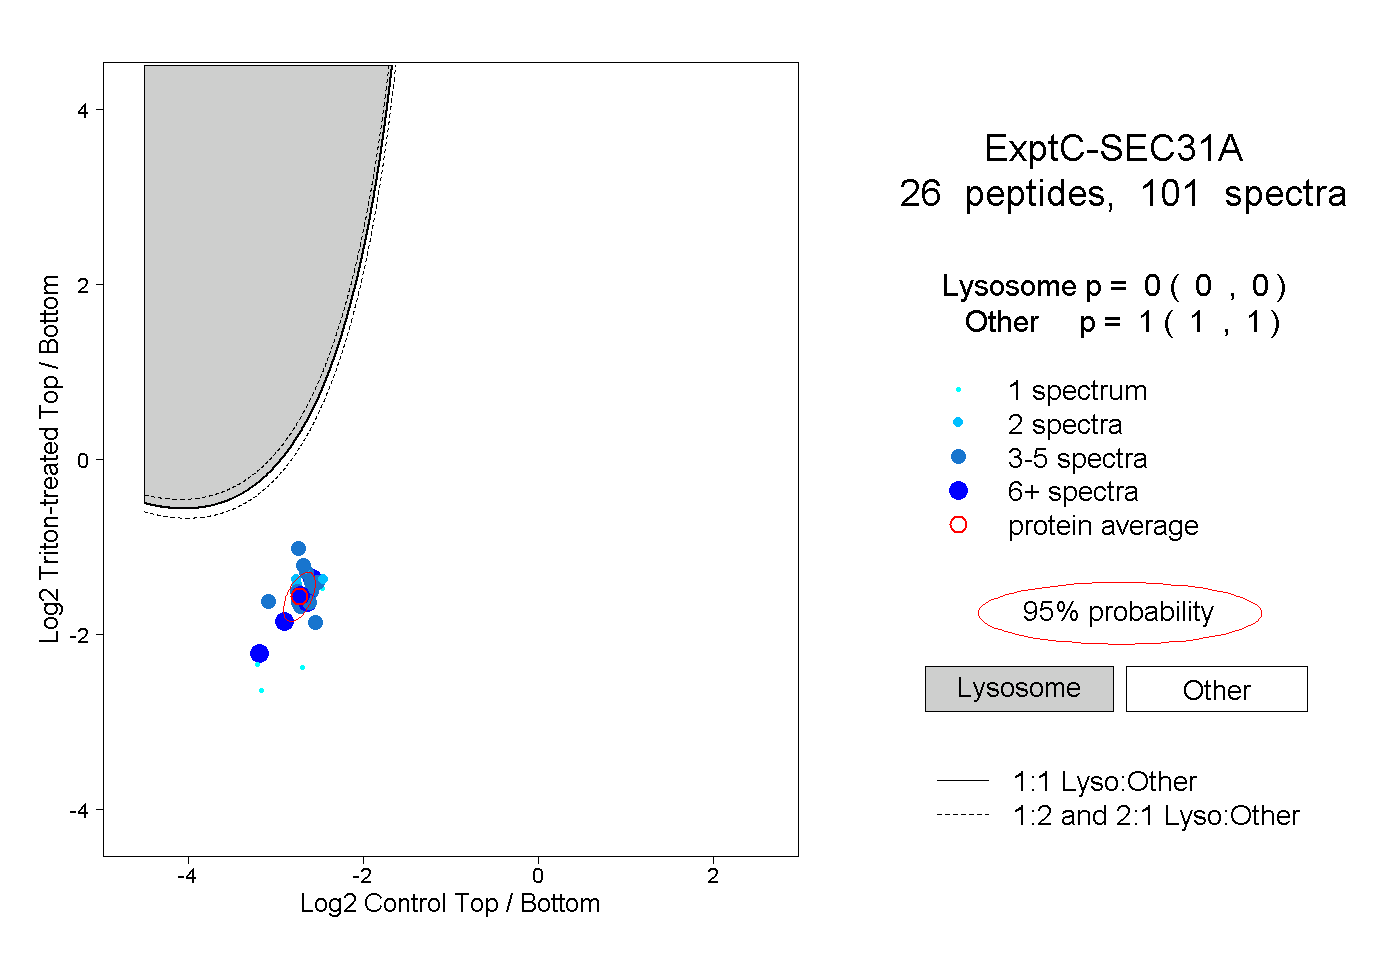
0.000 | 0.000
1.000 | 1.000
8peptides
spectra
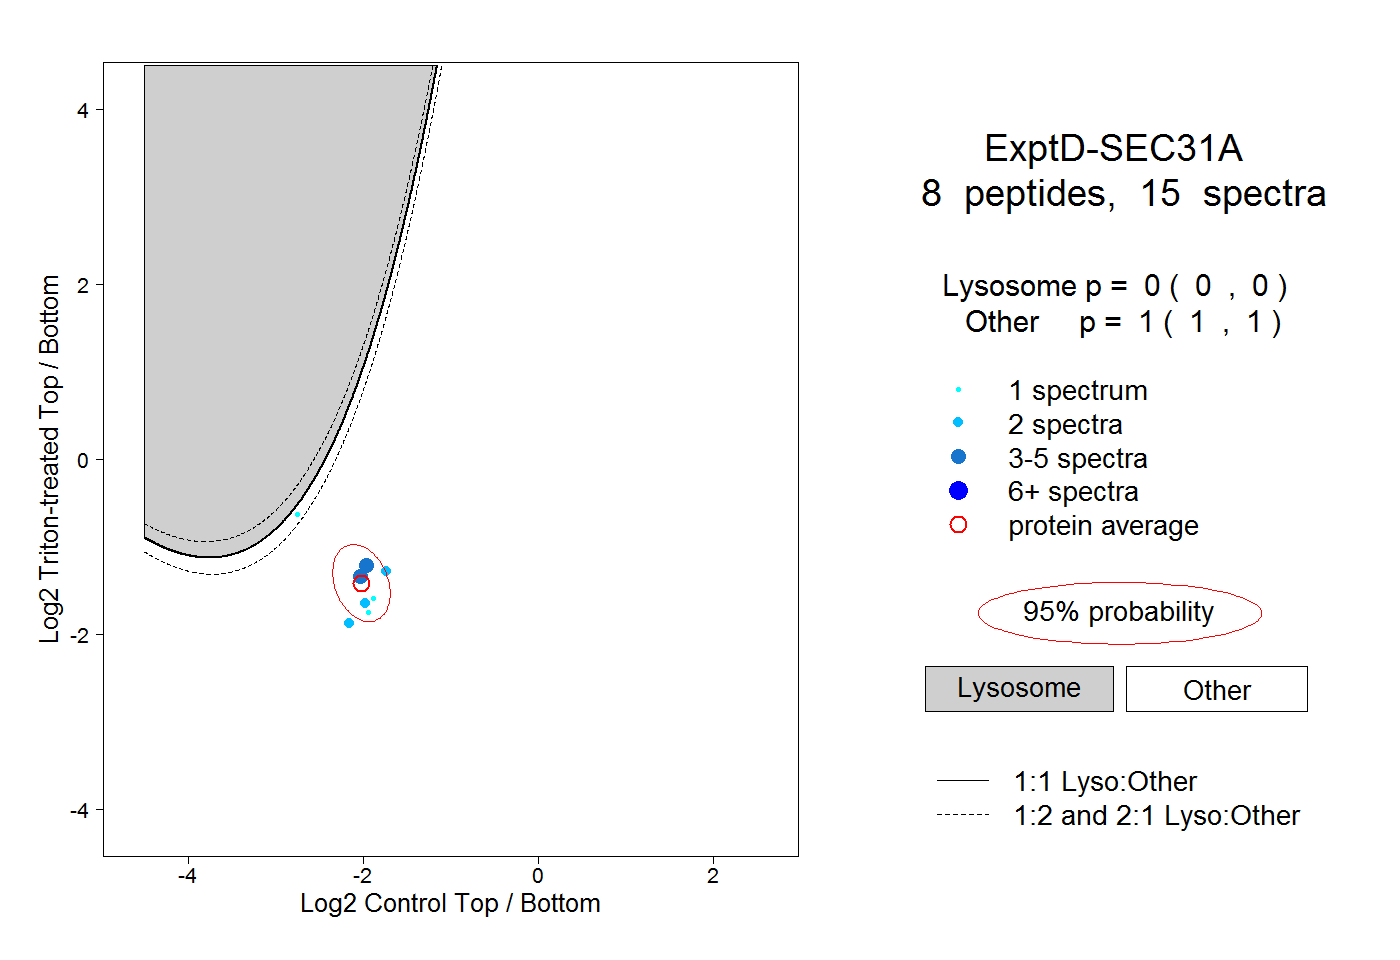
0.000 | 0.000
1.000 | 1.000