 31
31peptides
spectra
0.000 | 0.000
0.000 | 0.000
0.000 | 0.000
0.000 | 0.000
0.272 | 0.276
0.000 | 0.000
0.618 | 0.620
0.105 | 0.108
| Plot | Mito | Lyso | Perox | ER | Golgi | PM | Cytosol | Nucleus | |||||
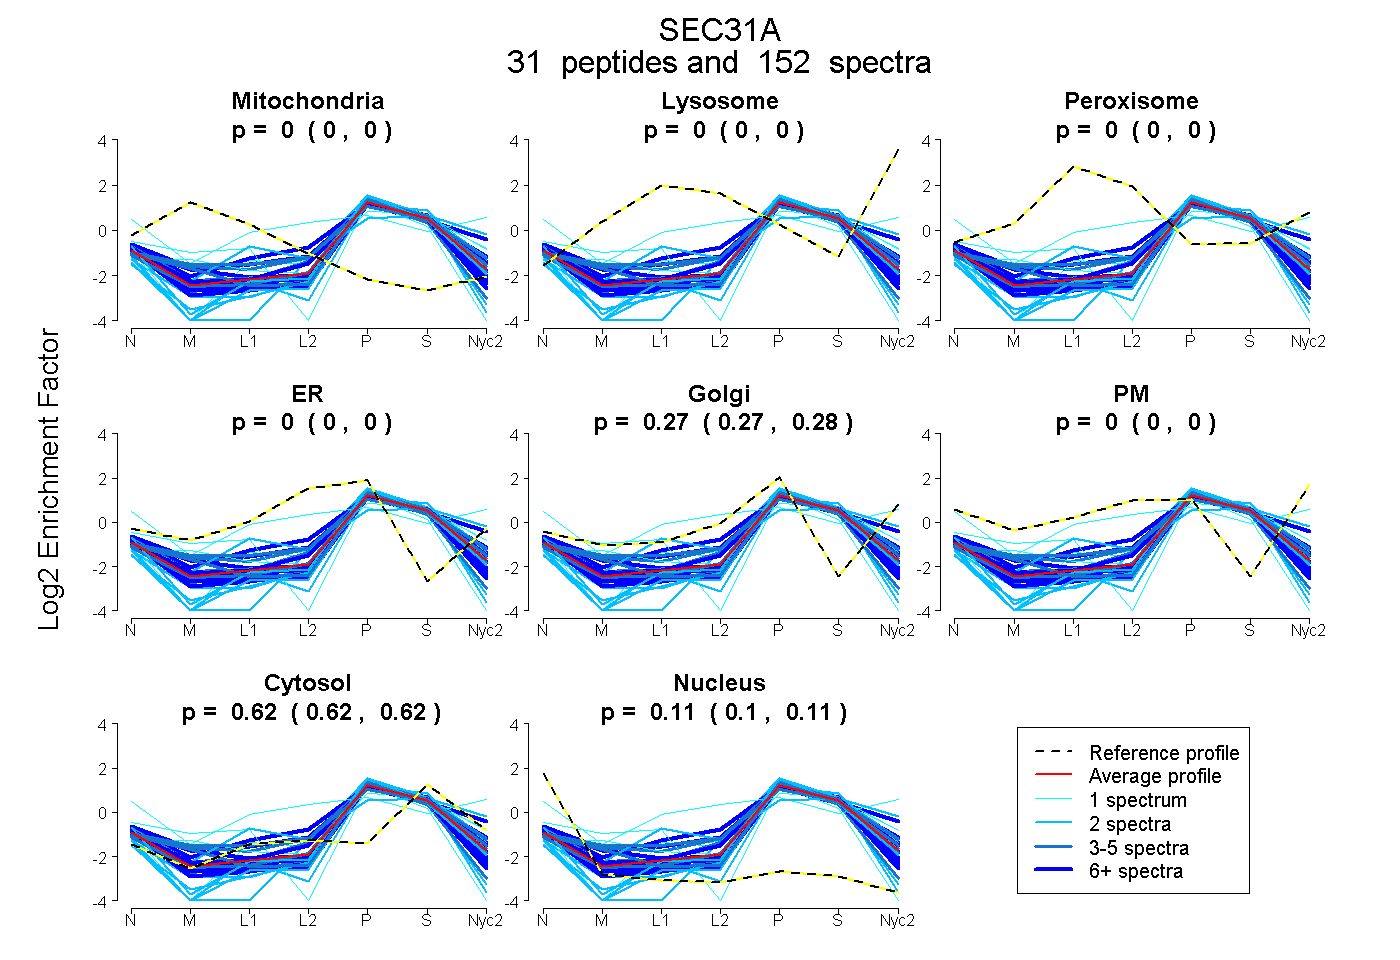
| Expt A |
31 peptides |
152 spectra |
|
0.000 0.000 | 0.000 |
0.000 0.000 | 0.000 |
0.000 0.000 | 0.000 |
0.000 0.000 | 0.000 |
0.274 0.272 | 0.276 |
0.000 0.000 | 0.000 |
0.619 0.618 | 0.620 |
0.107 0.105 | 0.108 |
| 2 spectra, LECLYDK | 0.000 | 0.000 | 0.000 | 0.000 | 0.244 | 0.000 | 0.712 | 0.045 | ||
| 6 spectra, RPVGASFSFGGK | 0.000 | 0.000 | 0.000 | 0.000 | 0.163 | 0.000 | 0.643 | 0.194 | ||
| 15 spectra, GGPGPLAGHPQVSR | 0.000 | 0.000 | 0.000 | 0.000 | 0.440 | 0.000 | 0.560 | 0.000 | ||
| 15 spectra, SVPGQESSR | 0.000 | 0.000 | 0.000 | 0.000 | 0.261 | 0.000 | 0.618 | 0.121 | ||
| 4 spectra, LITAVVMK | 0.000 | 0.000 | 0.000 | 0.000 | 0.241 | 0.000 | 0.575 | 0.183 | ||
| 2 spectra, VVLSQASK | 0.000 | 0.000 | 0.000 | 0.000 | 0.236 | 0.000 | 0.601 | 0.163 | ||
| 1 spectrum, GILAIAWSMADPELLLSCGK | 0.000 | 0.000 | 0.000 | 0.000 | 0.299 | 0.000 | 0.701 | 0.000 | ||
| 9 spectra, LIWGPHK | 0.000 | 0.000 | 0.000 | 0.000 | 0.203 | 0.000 | 0.641 | 0.155 | ||
| 4 spectra, VVILR | 0.000 | 0.000 | 0.000 | 0.000 | 0.267 | 0.000 | 0.639 | 0.094 | ||
| 3 spectra, IDASQTDFEK | 0.000 | 0.000 | 0.000 | 0.000 | 0.267 | 0.000 | 0.620 | 0.113 | ||
| 2 spectra, TTFEDLIQR | 0.000 | 0.000 | 0.000 | 0.000 | 0.148 | 0.000 | 0.696 | 0.157 | ||
| 9 spectra, FASSPLR | 0.000 | 0.000 | 0.000 | 0.006 | 0.400 | 0.000 | 0.569 | 0.024 | ||
| 8 spectra, NEPIIK | 0.000 | 0.000 | 0.000 | 0.000 | 0.211 | 0.000 | 0.604 | 0.186 | ||
| 5 spectra, NVWSFLK | 0.000 | 0.000 | 0.000 | 0.000 | 0.330 | 0.000 | 0.607 | 0.063 | ||
| 1 spectrum, QPVFISQVVTEK | 0.000 | 0.000 | 0.000 | 0.000 | 0.295 | 0.000 | 0.679 | 0.026 | ||
| 2 spectra, EVVIAQK | 0.000 | 0.000 | 0.000 | 0.000 | 0.232 | 0.000 | 0.700 | 0.069 | ||
| 5 spectra, VYSIMGGSIDGLR | 0.000 | 0.000 | 0.000 | 0.000 | 0.314 | 0.000 | 0.578 | 0.108 | ||
| 2 spectra, ALLTGNFESAVDLCLHDNR | 0.000 | 0.000 | 0.000 | 0.000 | 0.128 | 0.000 | 0.562 | 0.310 | ||
| 6 spectra, QVQHILASASPSGR | 0.000 | 0.000 | 0.000 | 0.000 | 0.220 | 0.000 | 0.585 | 0.196 | ||
| 1 spectrum, EDLGEK | 0.000 | 0.000 | 0.000 | 0.000 | 0.390 | 0.000 | 0.610 | 0.000 | ||
| 10 spectra, VNFEEDSR | 0.000 | 0.000 | 0.000 | 0.000 | 0.305 | 0.000 | 0.623 | 0.072 | ||
| 1 spectrum, TQACLCYICAGNVER | 0.000 | 0.000 | 0.070 | 0.015 | 0.000 | 0.527 | 0.388 | 0.000 | ||
| 2 spectra, TQPPEDISCIAWNR | 0.000 | 0.000 | 0.004 | 0.000 | 0.342 | 0.000 | 0.654 | 0.000 | ||
| 1 spectrum, SEQLQHVVQSQGFISYCQK | 0.152 | 0.000 | 0.000 | 0.000 | 0.112 | 0.000 | 0.433 | 0.304 | ||
| 3 spectra, LVACWTK | 0.000 | 0.000 | 0.000 | 0.293 | 0.000 | 0.000 | 0.566 | 0.141 | ||
| 2 spectra, VDGSDVALK | 0.000 | 0.000 | 0.000 | 0.000 | 0.135 | 0.000 | 0.761 | 0.104 | ||
| 6 spectra, NPAVLSAASFDGR | 0.000 | 0.000 | 0.000 | 0.000 | 0.244 | 0.000 | 0.614 | 0.141 | ||
| 15 spectra, IALALNR | 0.000 | 0.000 | 0.000 | 0.000 | 0.345 | 0.000 | 0.574 | 0.081 | ||
| 4 spectra, YLELLGYR | 0.000 | 0.000 | 0.000 | 0.012 | 0.362 | 0.000 | 0.626 | 0.000 | ||
| 2 spectra, EIVESCDLK | 0.000 | 0.000 | 0.000 | 0.000 | 0.096 | 0.000 | 0.650 | 0.254 | ||
| 4 spectra, LESEGDSLLR | 0.000 | 0.000 | 0.000 | 0.000 | 0.202 | 0.000 | 0.645 | 0.153 |
| Plot | Mito | Lyso or Perox | ER | Golgi | PM | Cytosol | Nucleus | ||||||
| Expt B |
23 peptides |
70 spectra |
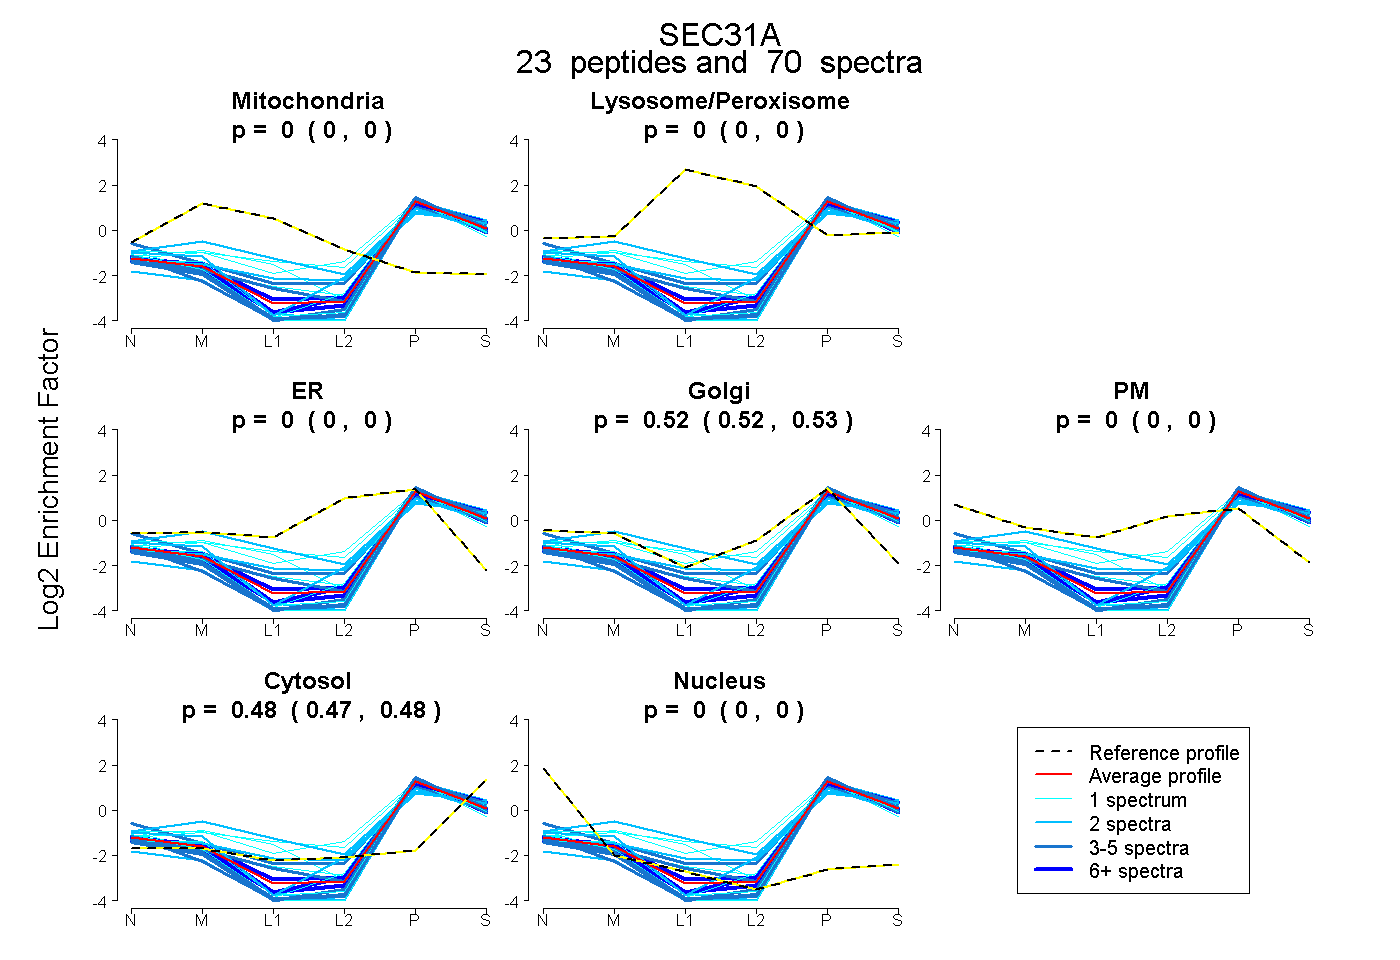 |
0.000 0.000 | 0.000 |
0.000 0.000 | 0.000 |
0.000 0.000 | 0.000 |
0.524 0.521 | 0.526 |
0.000 0.000 | 0.000 |
0.476 0.474 | 0.478 |
0.000 0.000 | 0.000 |
|||
| Plot | Lyso | Other | |||||||||||
| Expt C |
26 peptides |
101 spectra |
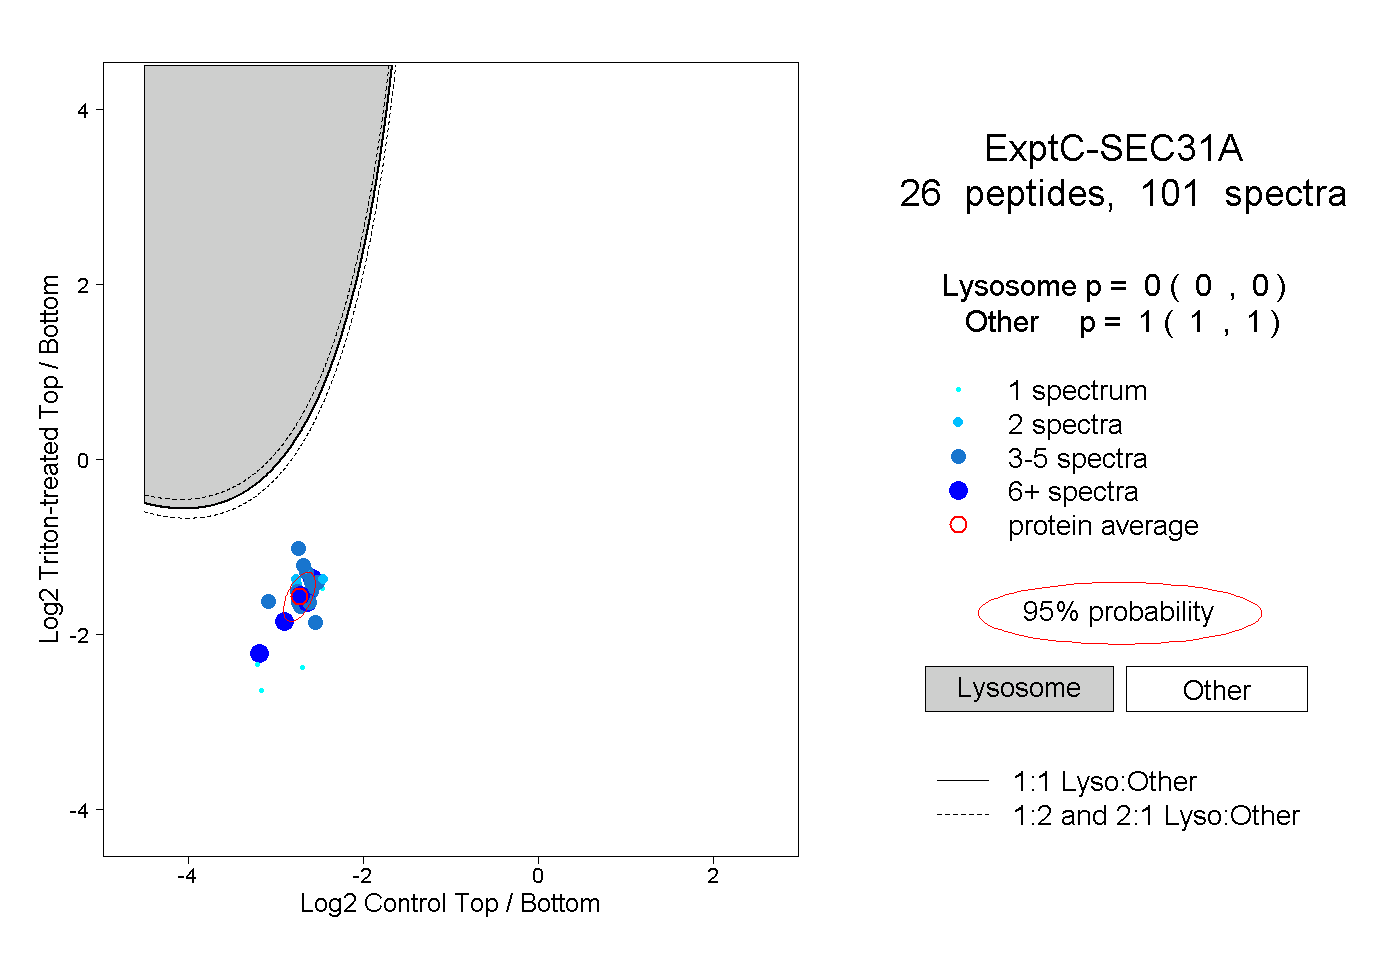 |
0.000 0.000 | 0.000 |
1.000 1.000 | 1.000 |
||||||||
| Plot | Lyso | Other | |||||||||||
| Expt D |
8 peptides |
15 spectra |
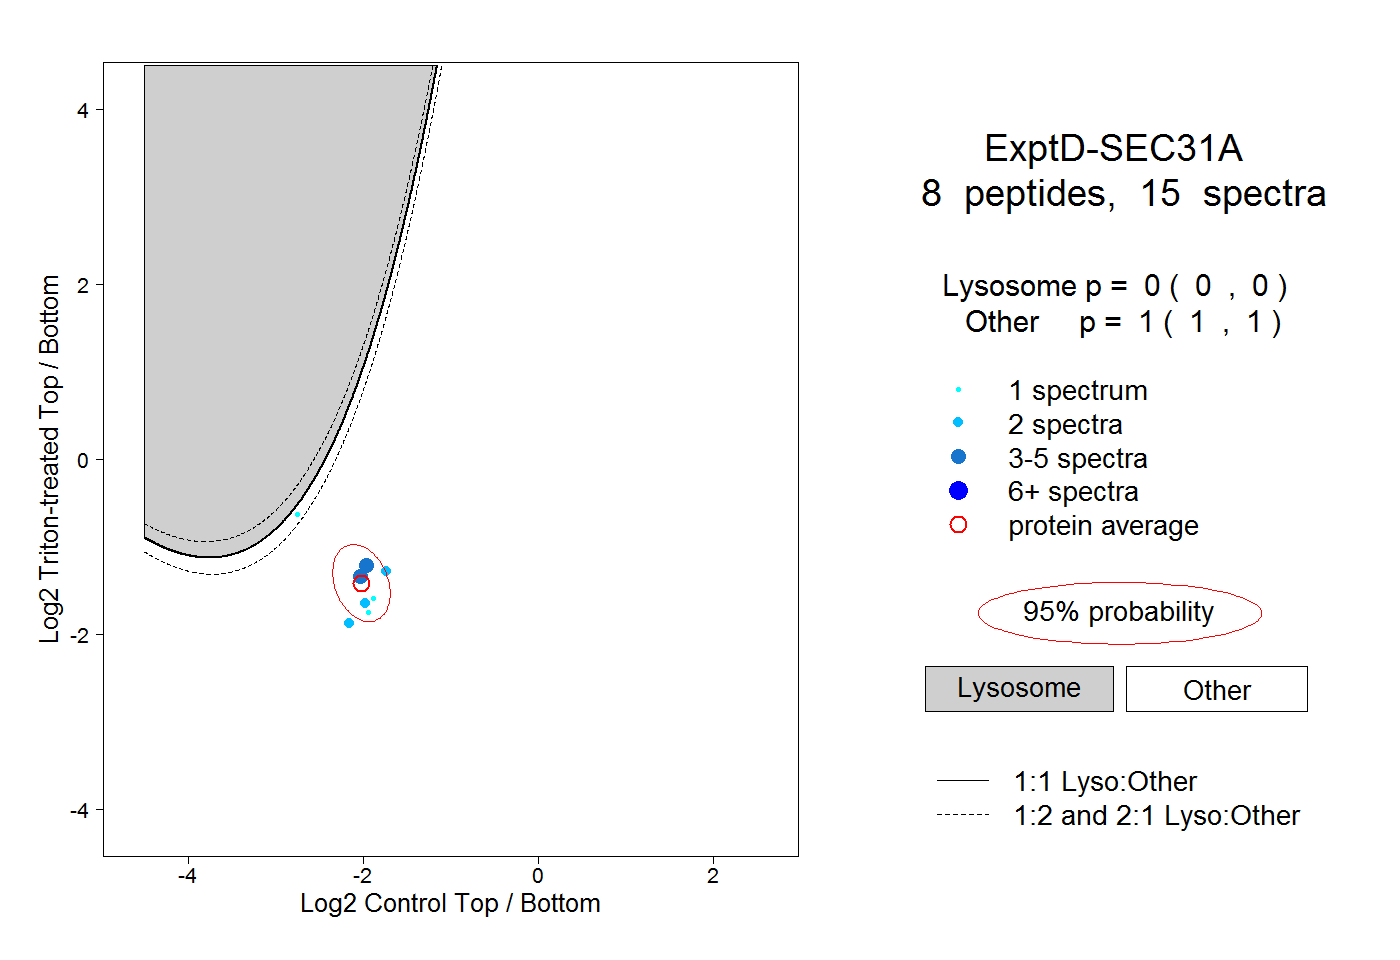 |
0.000 0.000 | 0.000 |
1.000 1.000 | 1.000 |