 5
5peptides
spectra
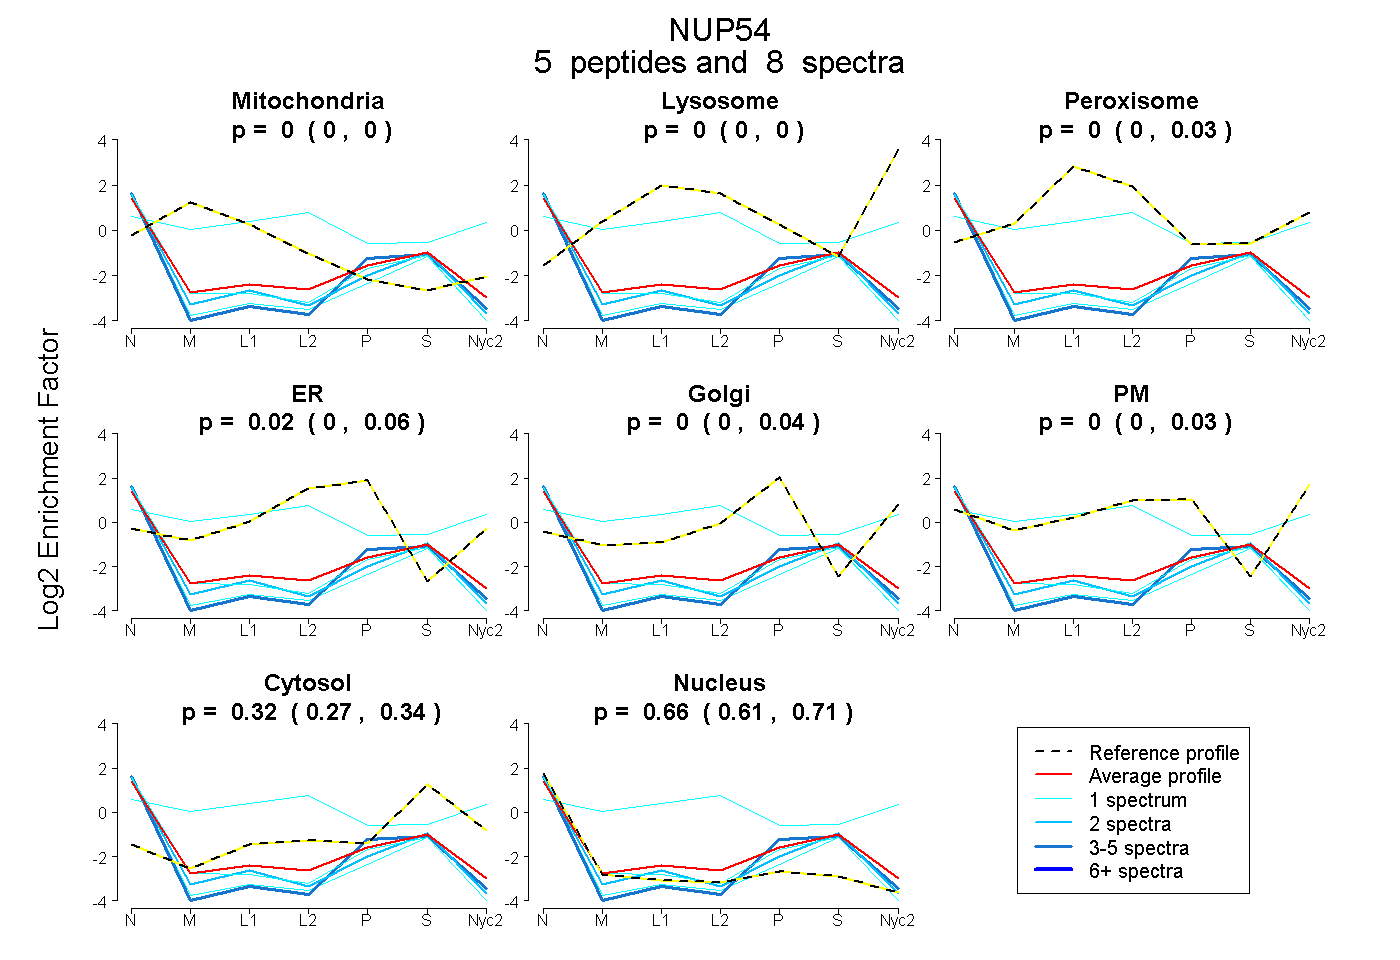
0.000 | 0.000
0.000 | 0.000
0.000 | 0.031
0.000 | 0.055
0.000 | 0.038
0.000 | 0.032
0.269 | 0.337
0.610 | 0.709
1peptide
spectrum
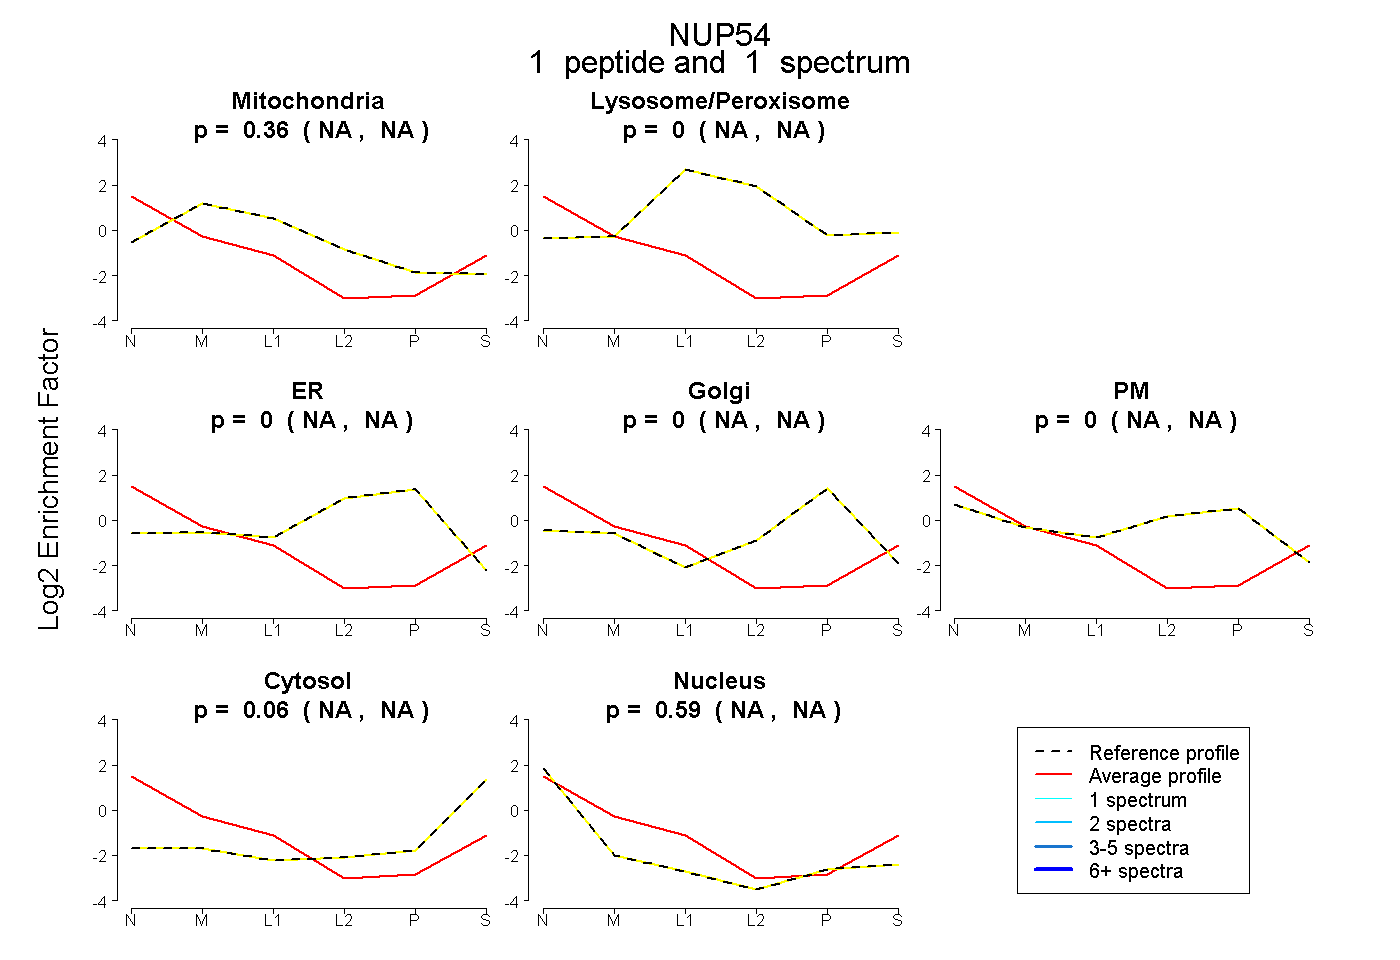
NA | NA
NA | NA
NA | NA
NA | NA
NA | NA
NA | NA
NA | NA
2peptides
spectra
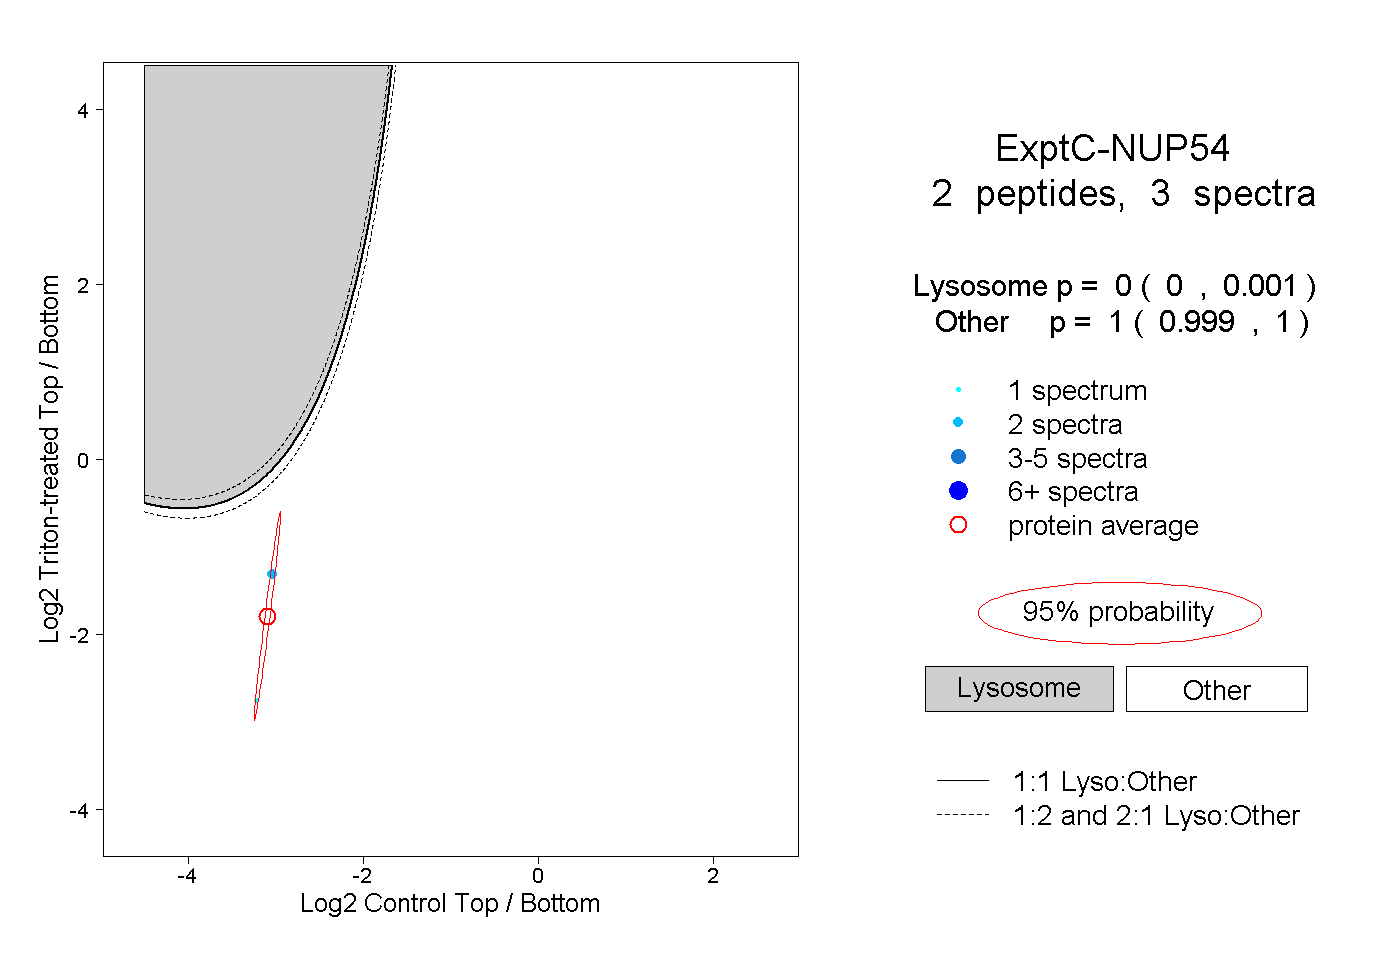
0.000 | 0.001
0.999 | 1.000