 8
8peptides
spectra
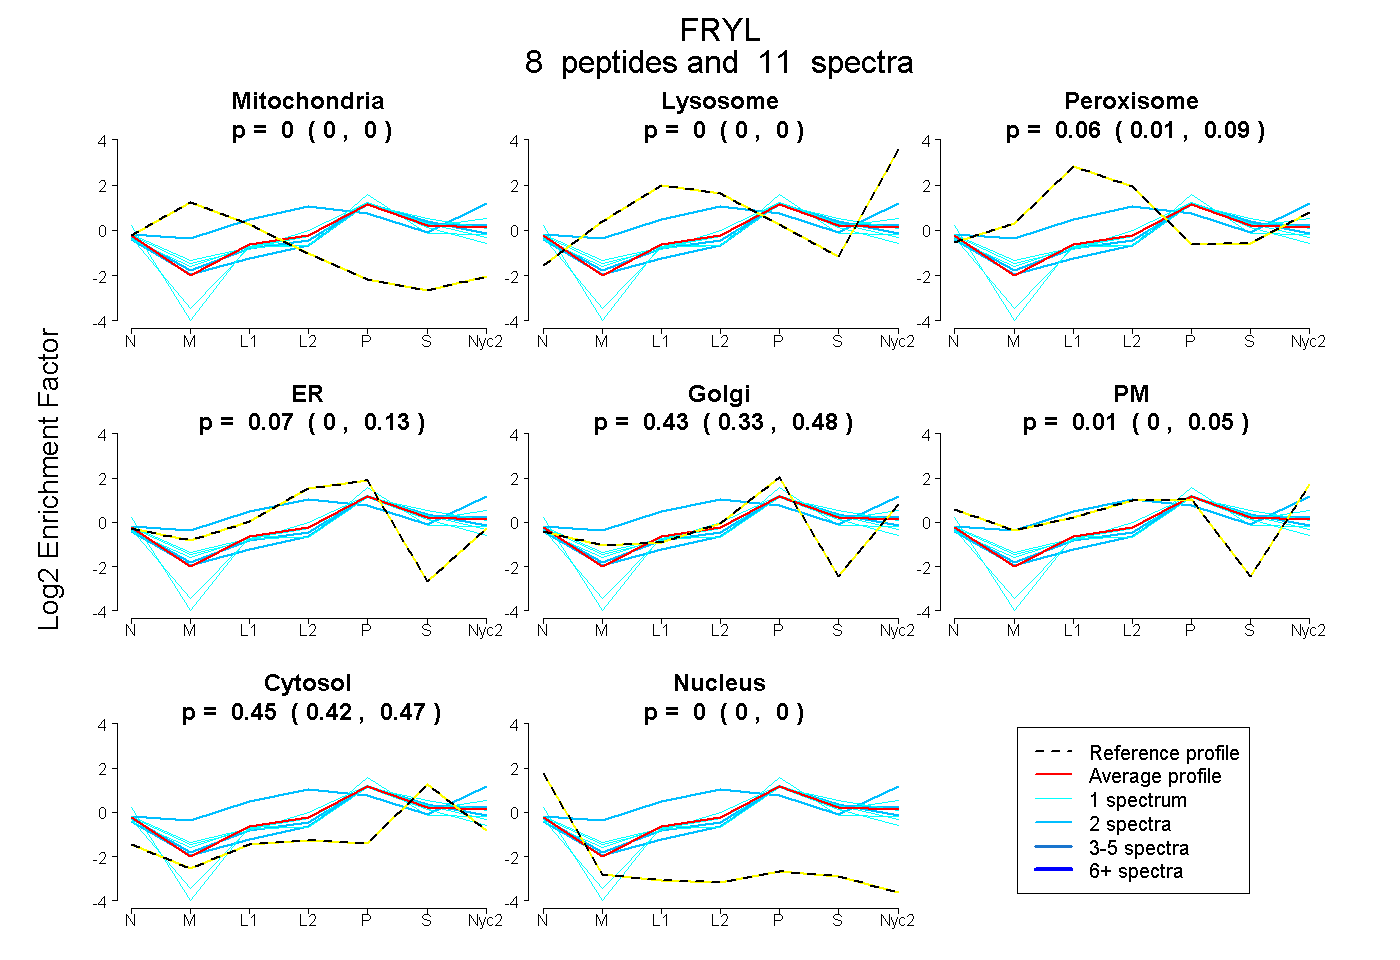
0.000 | 0.000
0.000 | 0.000
0.007 | 0.085
0.000 | 0.135
0.326 | 0.481
0.000 | 0.055
0.418 | 0.471
0.000 | 0.000
3peptides
spectra
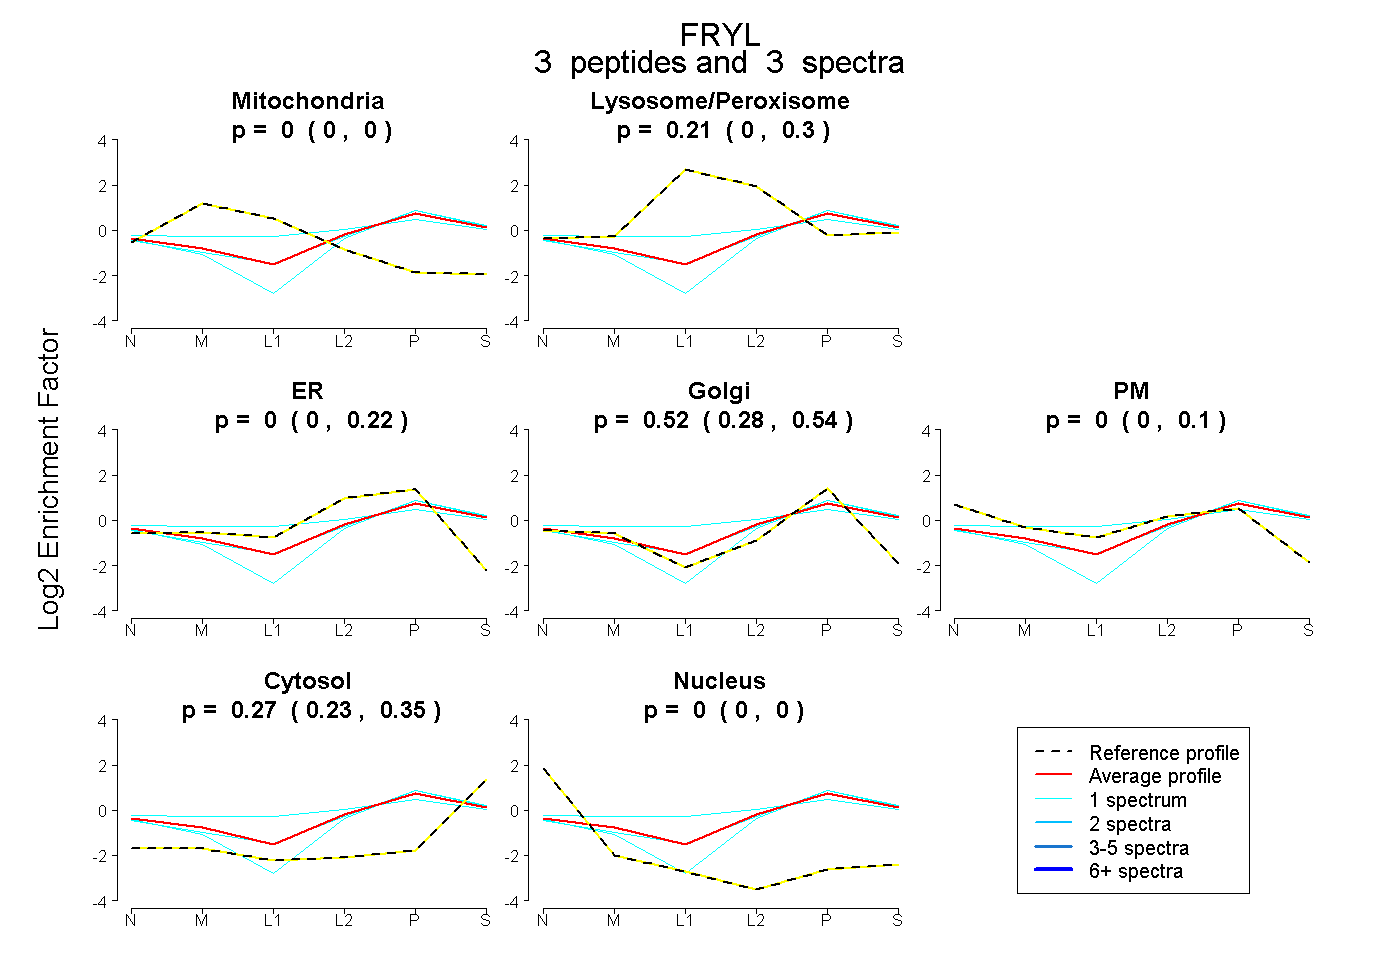
0.000 | 0.000
0.000 | 0.304
0.000 | 0.223
0.276 | 0.542
0.000 | 0.104
0.225 | 0.354
0.000 | 0.000
5peptides
spectra
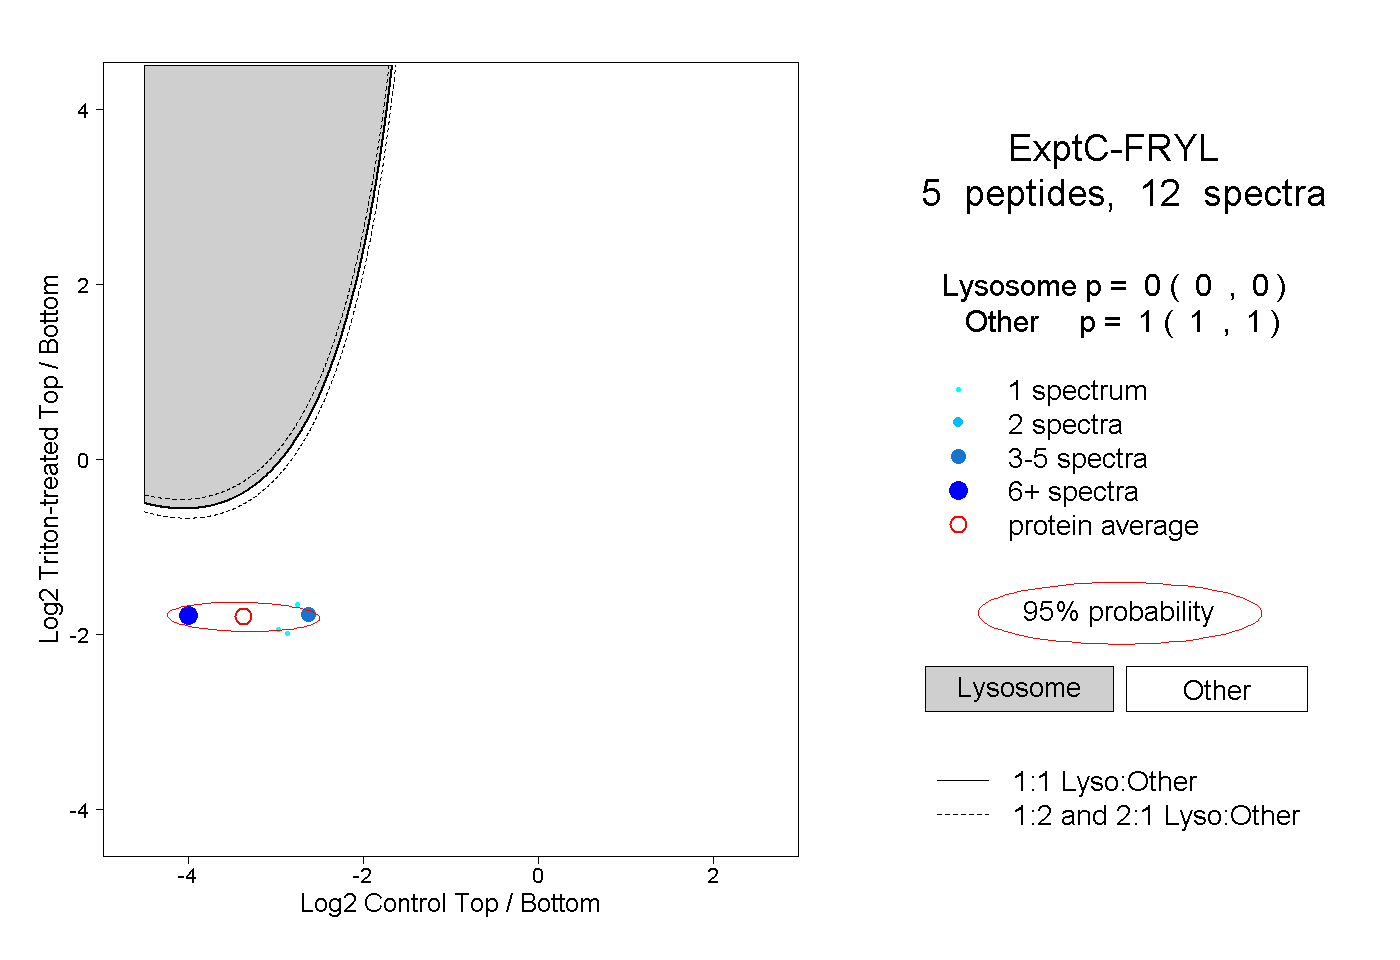
0.000 | 0.000
1.000 | 1.000