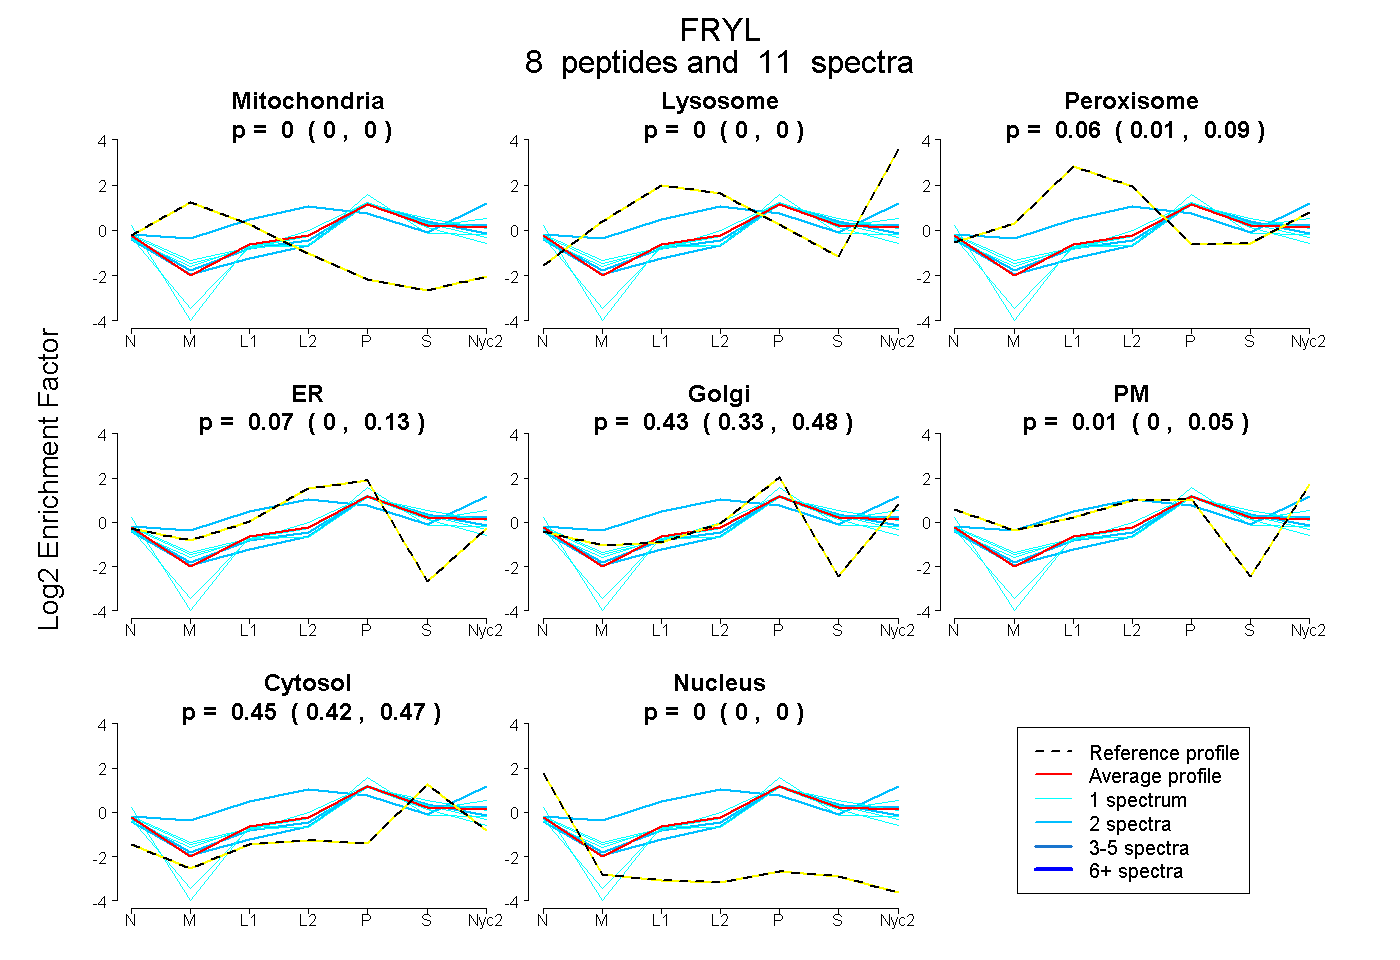
 8
8peptides
spectra
0.000 | 0.000
0.000 | 0.000
0.007 | 0.085
0.000 | 0.135
0.326 | 0.481
0.000 | 0.055
0.418 | 0.471
0.000 | 0.000
| Plot | Mito | Lyso | Perox | ER | Golgi | PM | Cytosol | Nucleus | |||||
| Expt A |
8 peptides |
11 spectra |
|
0.000 0.000 | 0.000 |
0.000 0.000 | 0.000 |
0.056 0.007 | 0.085 |
0.066 0.000 | 0.135 |
0.425 0.326 | 0.481 |
0.007 0.000 | 0.055 |
0.445 0.418 | 0.471 |
0.000 0.000 | 0.000 |
| 1 spectrum, IVGIPSPSSLFK | 0.000 | 0.000 | 0.000 | 0.002 | 0.510 | 0.000 | 0.484 | 0.004 | ||
| 2 spectra, EIIFDLLSVGK | 0.000 | 0.000 | 0.000 | 0.000 | 0.485 | 0.000 | 0.515 | 0.000 | ||
| 2 spectra, LLTHLPLDK | 0.000 | 0.150 | 0.263 | 0.004 | 0.101 | 0.272 | 0.209 | 0.000 | ||
| 1 spectrum, SFQIFR | 0.000 | 0.035 | 0.020 | 0.000 | 0.374 | 0.163 | 0.408 | 0.000 | ||
| 1 spectrum, ELIEELHPIIK | 0.000 | 0.000 | 0.026 | 0.214 | 0.285 | 0.000 | 0.475 | 0.000 | ||
| 1 spectrum, TCIAAIPR | 0.000 | 0.000 | 0.000 | 0.390 | 0.142 | 0.000 | 0.468 | 0.000 | ||
| 1 spectrum, VIAVTR | 0.000 | 0.000 | 0.000 | 0.000 | 0.415 | 0.000 | 0.585 | 0.000 | ||
| 2 spectra, AIANVFQNR | 0.000 | 0.000 | 0.051 | 0.000 | 0.492 | 0.000 | 0.456 | 0.000 |
| Plot | Mito | Lyso or Perox | ER | Golgi | PM | Cytosol | Nucleus | ||||||
| Expt B |
3 peptides |
3 spectra |
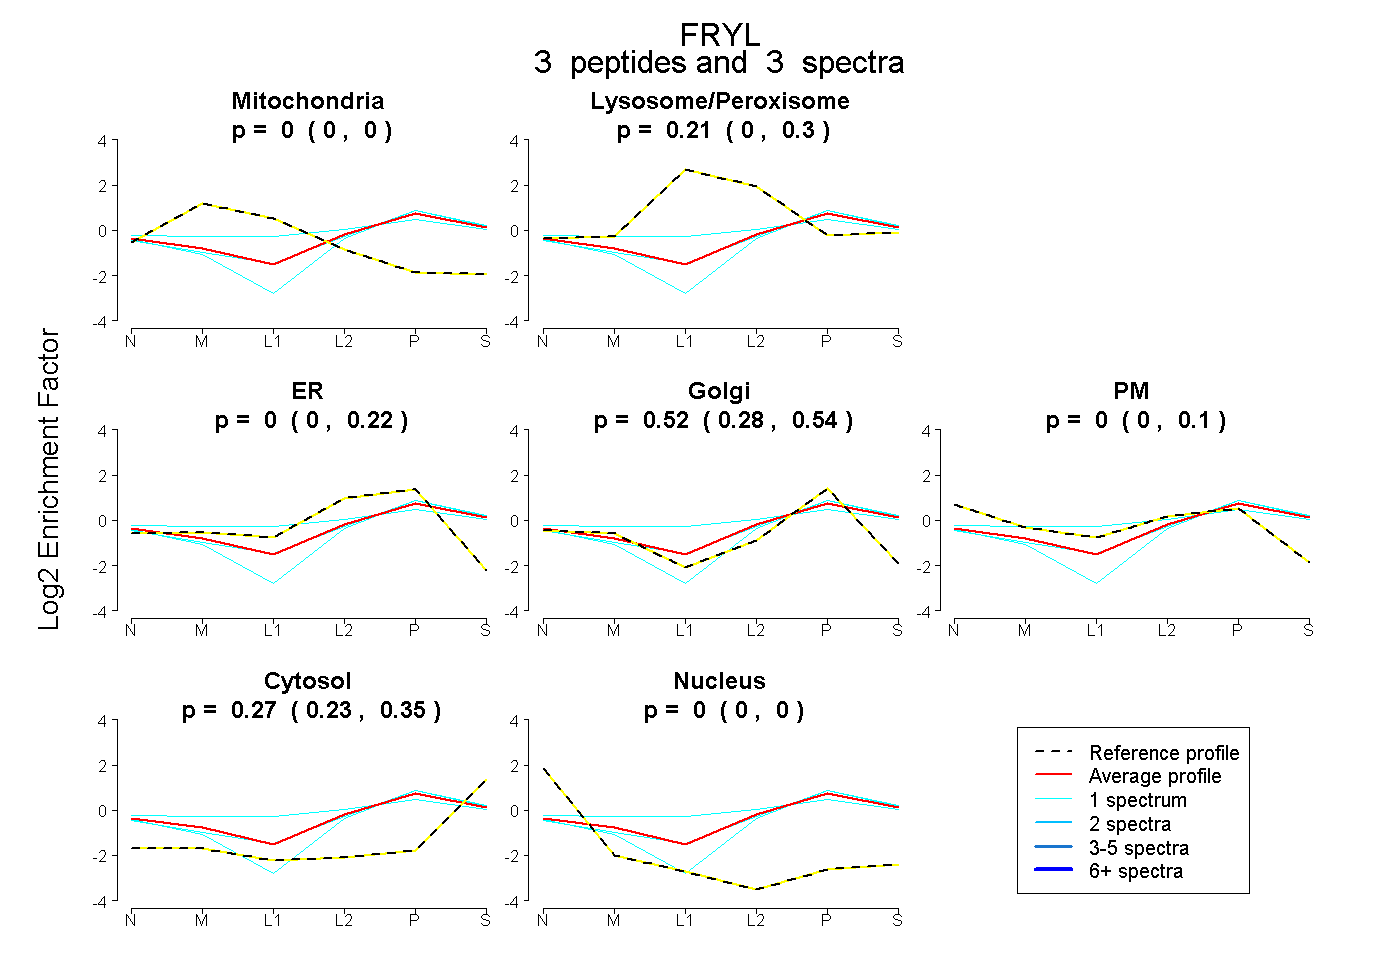 |
0.000 0.000 | 0.000 |
0.209 0.000 | 0.304 |
0.000 0.000 | 0.223 |
0.524 0.276 | 0.542 |
0.000 0.000 | 0.104 |
0.267 0.225 | 0.354 |
0.000 0.000 | 0.000 |
|||
| Plot | Lyso | Other | |||||||||||
| Expt C |
5 peptides |
12 spectra |
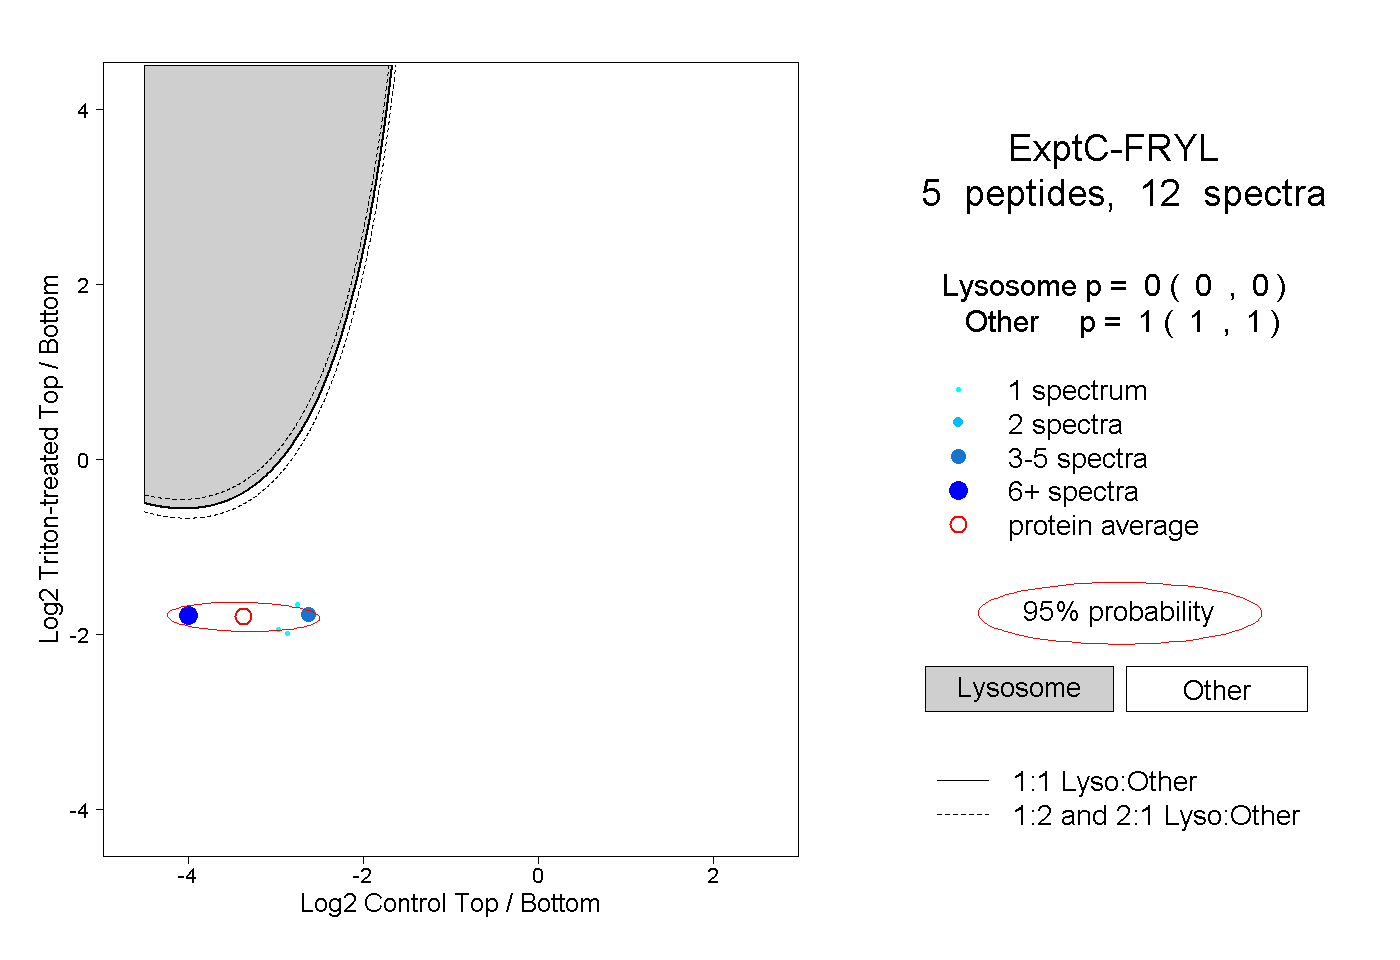 |
0.000 0.000 | 0.000 |
1.000 1.000 | 1.000 |