 16
16peptides
spectra
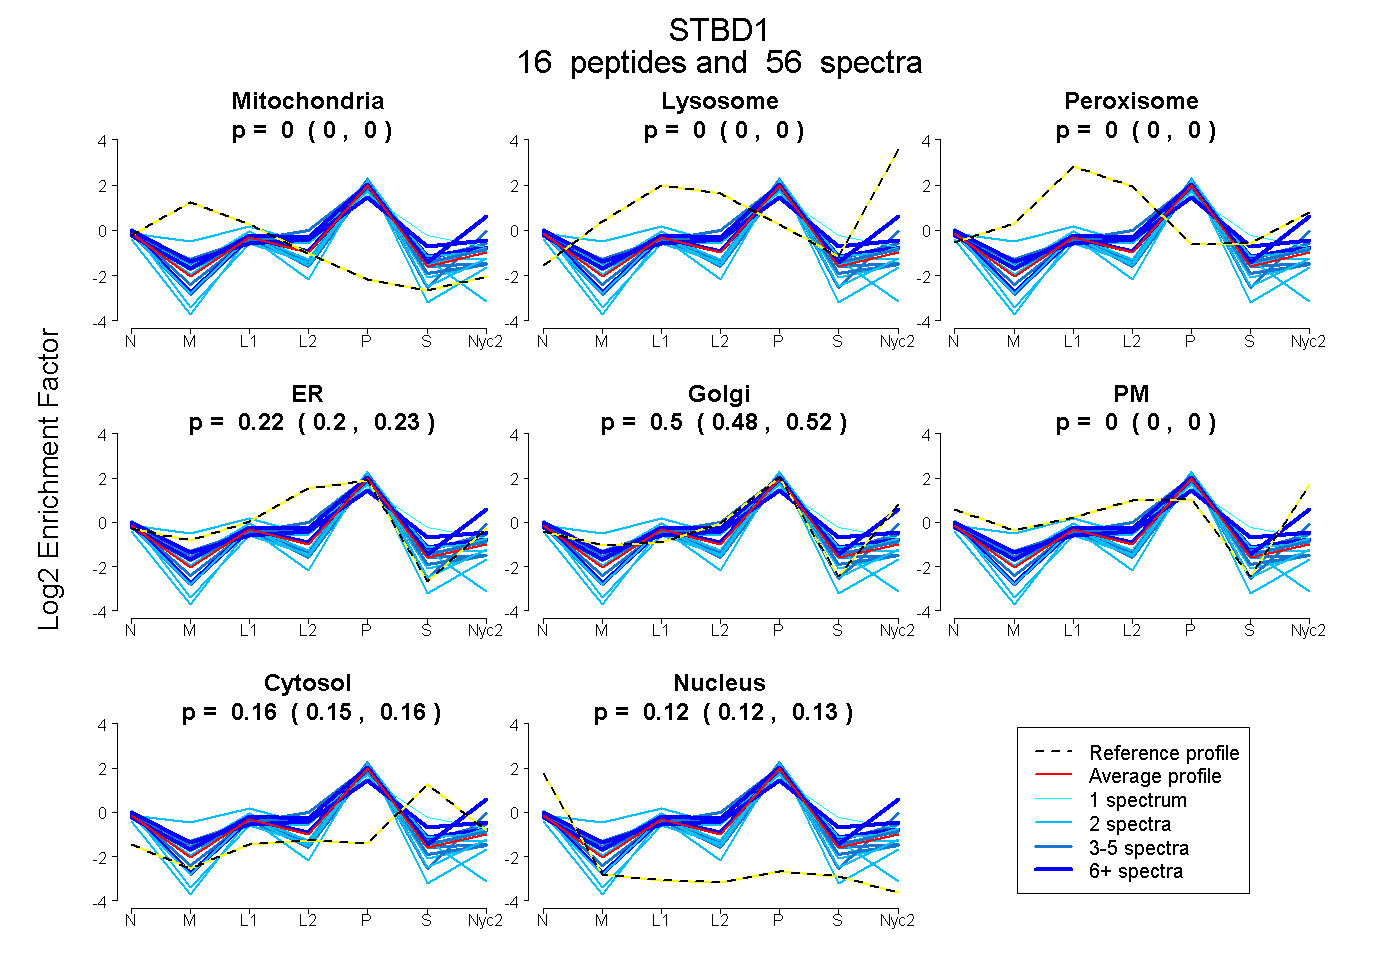
0.000 | 0.000
0.000 | 0.000
0.000 | 0.000
0.201 | 0.235
0.479 | 0.518
0.000 | 0.000
0.149 | 0.164
0.118 | 0.128
7peptides
spectra
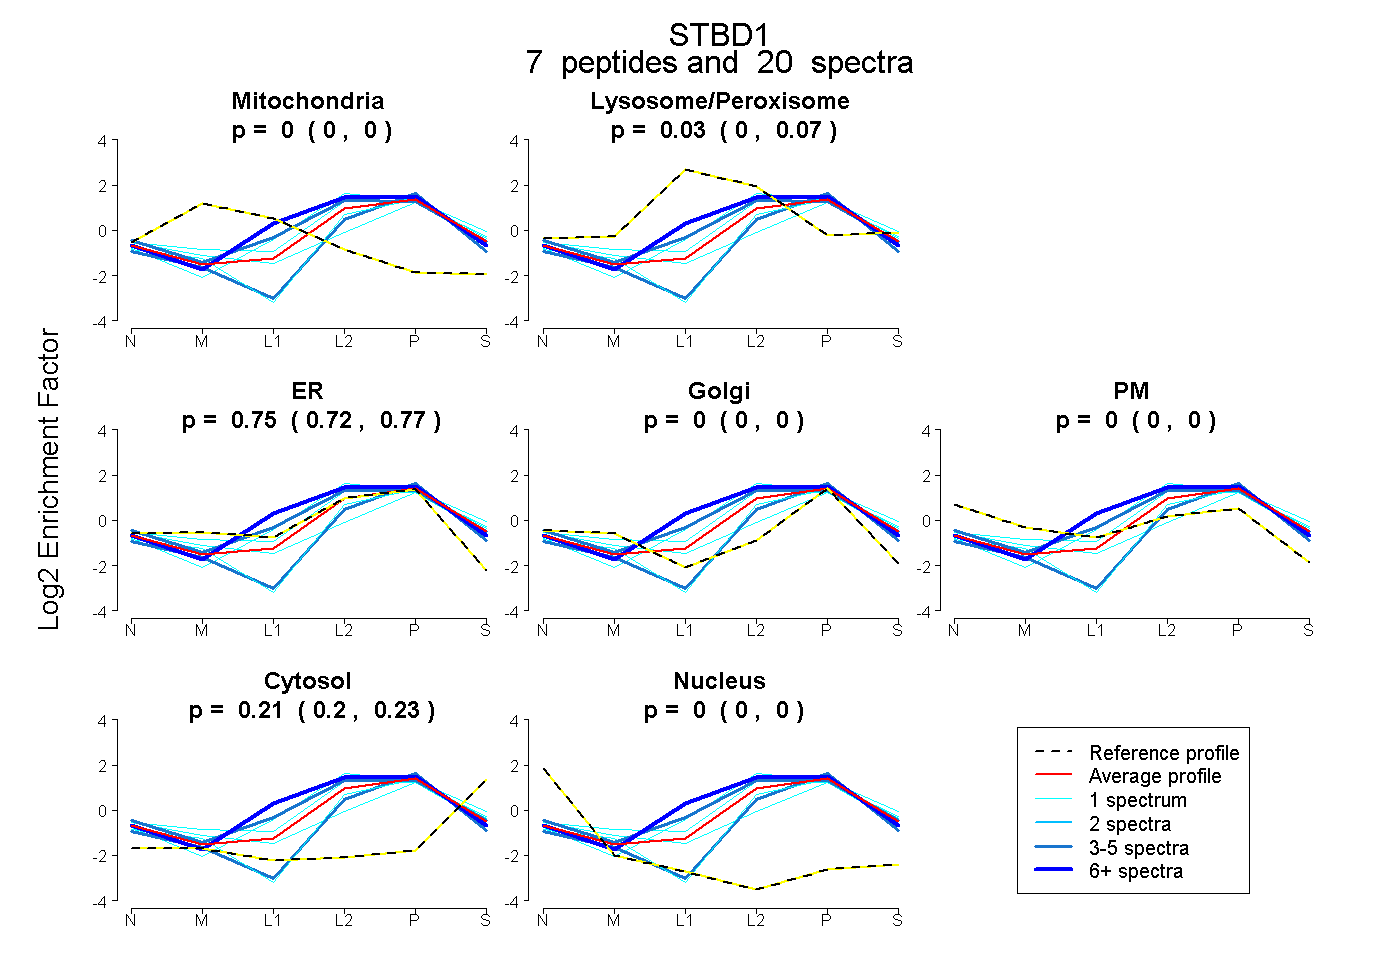
0.000 | 0.000
0.000 | 0.072
0.723 | 0.774
0.000 | 0.000
0.000 | 0.000
0.196 | 0.229
0.000 | 0.000
12peptides
spectra
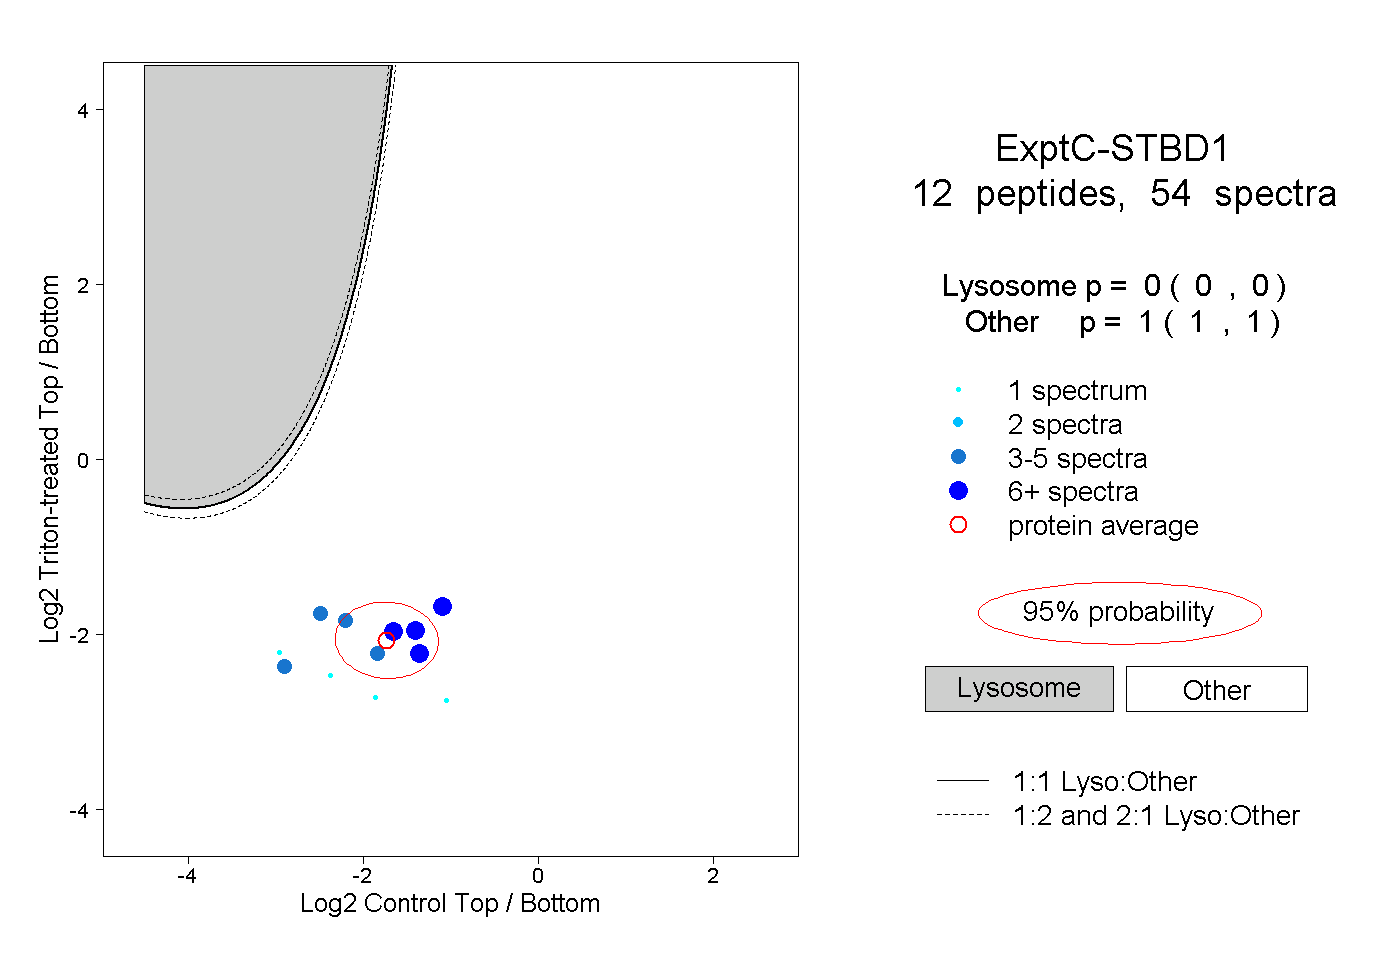
0.000 | 0.000
1.000 | 1.000
5peptides
spectra
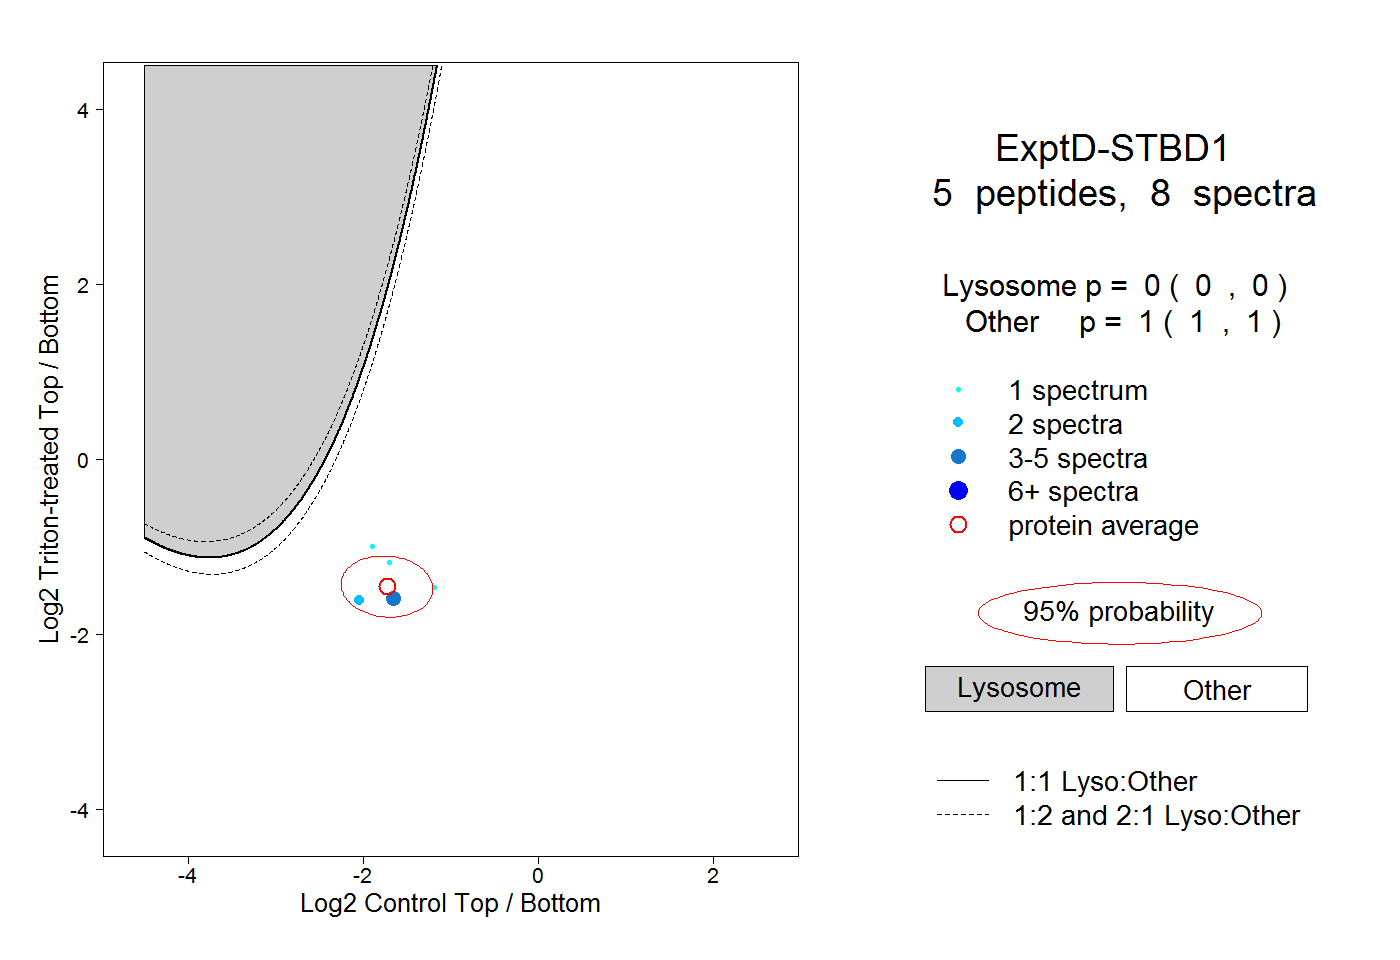
0.000 | 0.000
1.000 | 1.000