 16
16peptides
spectra
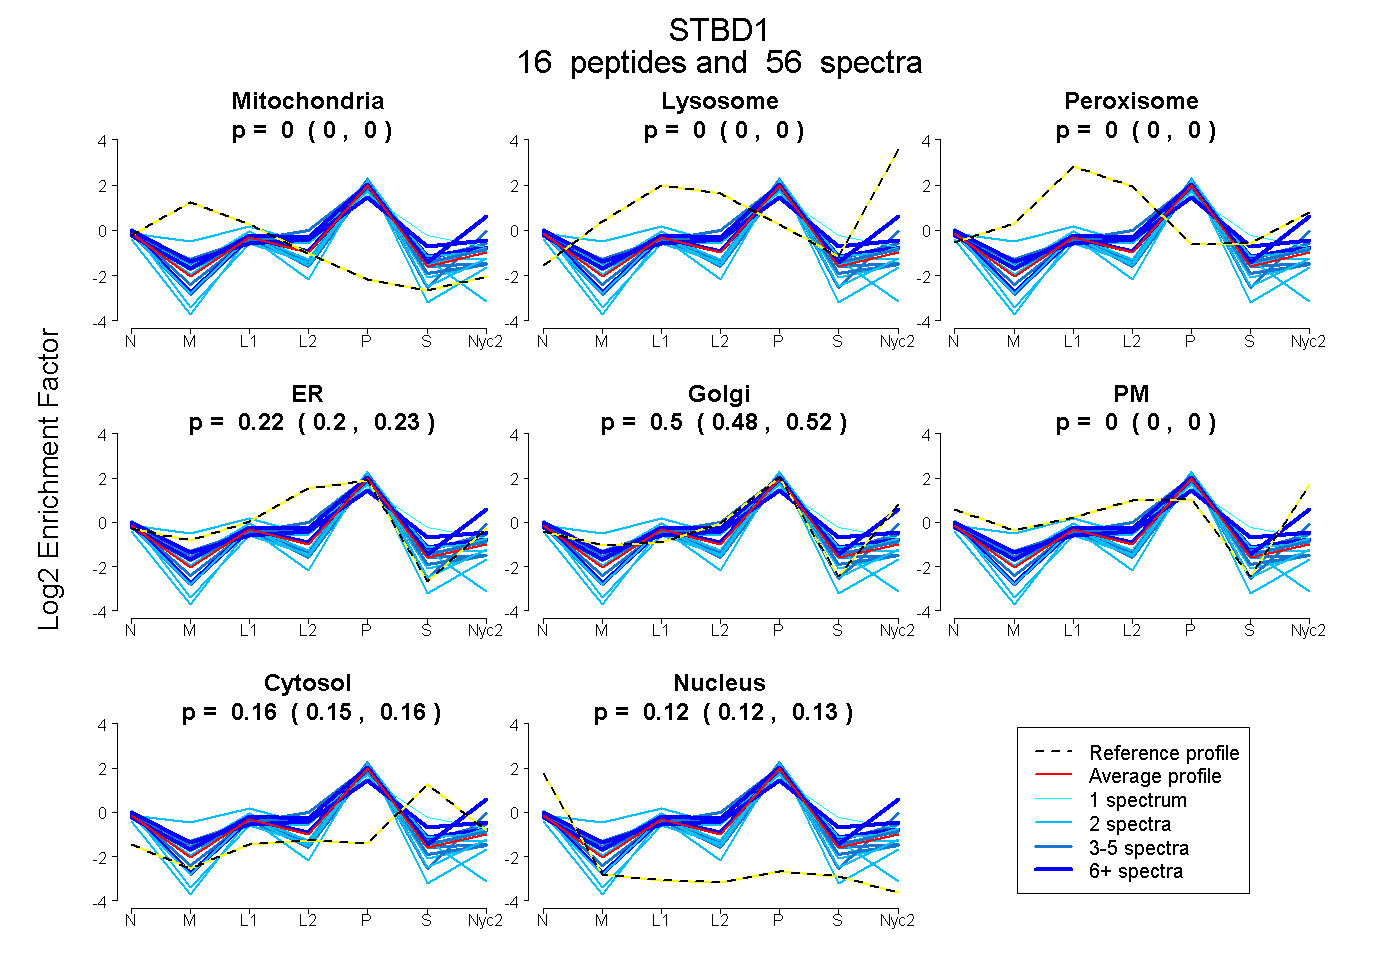
0.000 | 0.000
0.000 | 0.000
0.000 | 0.000
0.201 | 0.235
0.479 | 0.518
0.000 | 0.000
0.149 | 0.164
0.118 | 0.128
| Plot | Mito | Lyso | Perox | ER | Golgi | PM | Cytosol | Nucleus | |||||
| Expt A |
16 peptides |
56 spectra |
|
0.000 0.000 | 0.000 |
0.000 0.000 | 0.000 |
0.000 0.000 | 0.000 |
0.219 0.201 | 0.235 |
0.500 0.479 | 0.518 |
0.000 0.000 | 0.000 |
0.158 0.149 | 0.164 |
0.123 0.118 | 0.128 |
| 6 spectra, WEECSNR | 0.000 | 0.000 | 0.000 | 0.268 | 0.390 | 0.000 | 0.325 | 0.017 | ||
| 2 spectra, DLGNLTEAQR | 0.000 | 0.000 | 0.000 | 0.344 | 0.418 | 0.000 | 0.000 | 0.239 | ||
| 4 spectra, LQNVGNAR | 0.000 | 0.000 | 0.000 | 0.000 | 0.849 | 0.000 | 0.000 | 0.151 | ||
| 6 spectra, NSLVGGGWEVDGK | 0.000 | 0.000 | 0.000 | 0.152 | 0.513 | 0.000 | 0.254 | 0.080 | ||
| 5 spectra, AEAASLAQSAGHEDWEVVSR | 0.000 | 0.000 | 0.000 | 0.183 | 0.497 | 0.000 | 0.128 | 0.192 | ||
| 2 spectra, FVLVENK | 0.000 | 0.000 | 0.000 | 0.403 | 0.282 | 0.000 | 0.208 | 0.107 | ||
| 2 spectra, LPSSSPLMDR | 0.000 | 0.000 | 0.000 | 0.298 | 0.146 | 0.000 | 0.253 | 0.304 | ||
| 4 spectra, LQTGHEDK | 0.000 | 0.000 | 0.000 | 0.408 | 0.358 | 0.000 | 0.221 | 0.014 | ||
| 2 spectra, NQSPESR | 0.000 | 0.000 | 0.000 | 0.054 | 0.679 | 0.000 | 0.000 | 0.267 | ||
| 7 spectra, VVSVKPR | 0.000 | 0.000 | 0.062 | 0.000 | 0.817 | 0.000 | 0.122 | 0.000 | ||
| 2 spectra, EYVPVGK | 0.000 | 0.000 | 0.000 | 0.294 | 0.451 | 0.000 | 0.055 | 0.201 | ||
| 2 spectra, VPDTHSR | 0.170 | 0.000 | 0.017 | 0.263 | 0.445 | 0.000 | 0.106 | 0.000 | ||
| 4 spectra, LSLNQGMDESR | 0.000 | 0.000 | 0.000 | 0.168 | 0.521 | 0.000 | 0.100 | 0.212 | ||
| 2 spectra, VAGSVAEK | 0.000 | 0.000 | 0.000 | 0.000 | 0.642 | 0.000 | 0.248 | 0.111 | ||
| 5 spectra, VVHGWWGIH | 0.000 | 0.000 | 0.000 | 0.426 | 0.335 | 0.000 | 0.182 | 0.056 | ||
| 1 spectrum, QVSIQFK | 0.000 | 0.000 | 0.000 | 0.328 | 0.262 | 0.000 | 0.410 | 0.000 |
| Plot | Mito | Lyso or Perox | ER | Golgi | PM | Cytosol | Nucleus | ||||||
| Expt B |
7 peptides |
20 spectra |
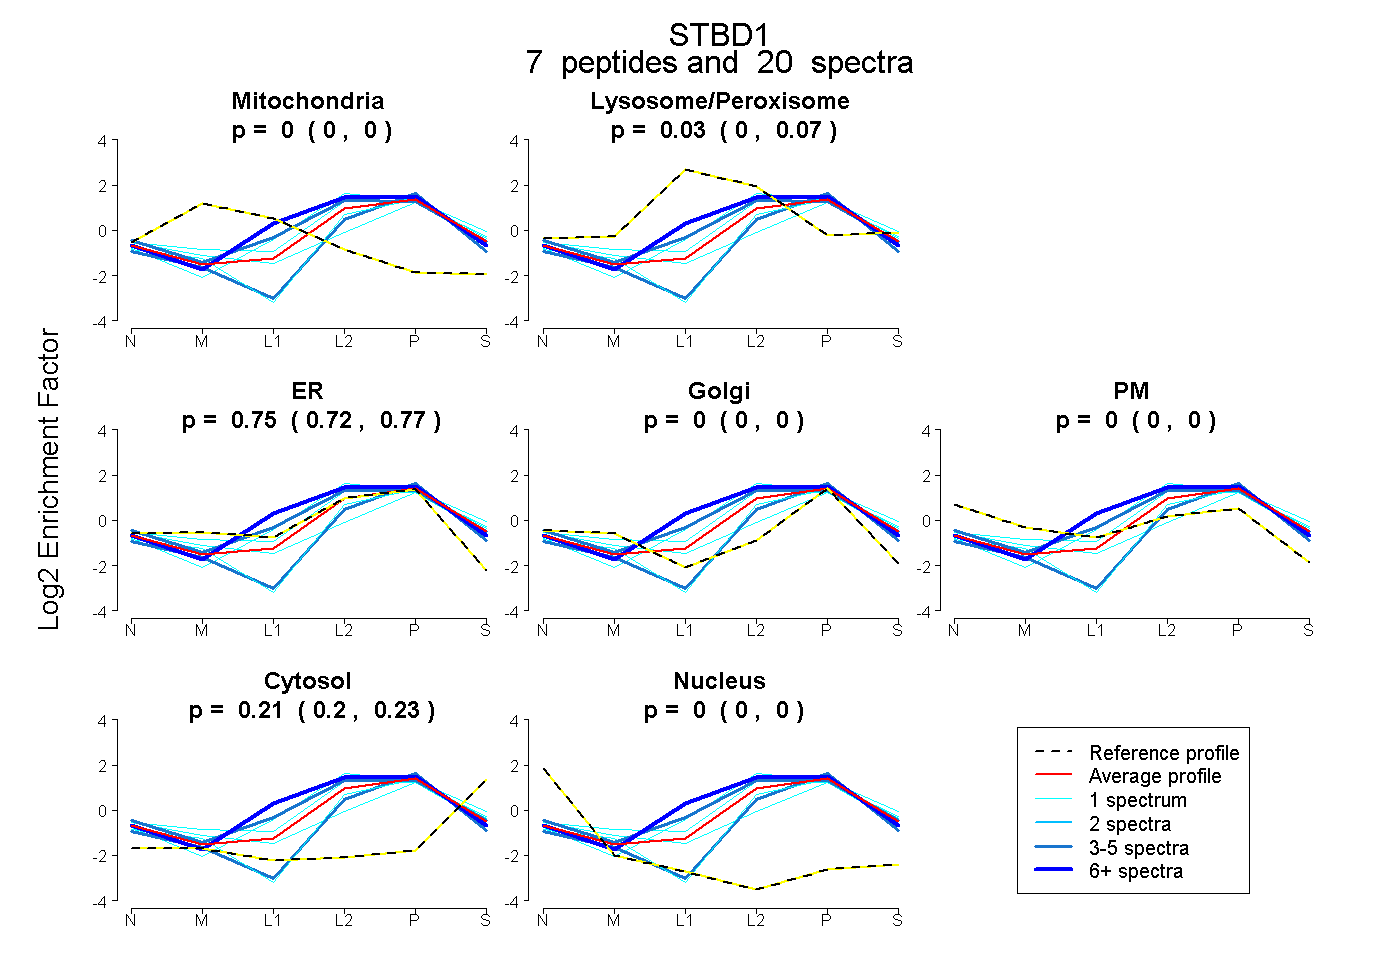 |
0.000 0.000 | 0.000 |
0.034 0.000 | 0.072 |
0.752 0.723 | 0.774 |
0.000 0.000 | 0.000 |
0.000 0.000 | 0.000 |
0.214 0.196 | 0.229 |
0.000 0.000 | 0.000 |
|||
| Plot | Lyso | Other | |||||||||||
| Expt C |
12 peptides |
54 spectra |
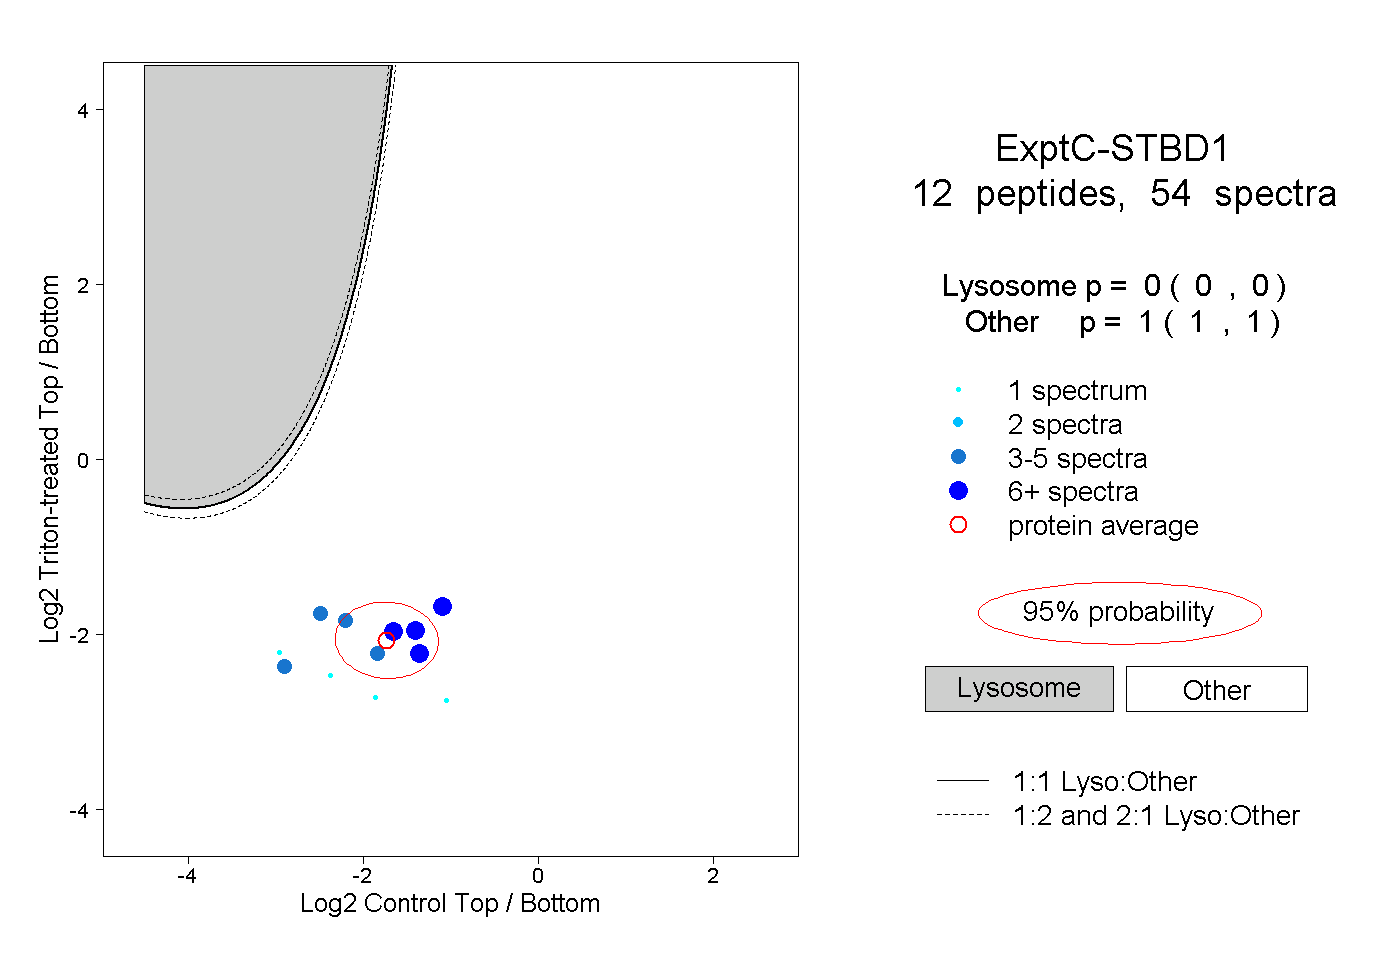 |
0.000 0.000 | 0.000 |
1.000 1.000 | 1.000 |
||||||||
| Plot | Lyso | Other | |||||||||||
| Expt D |
5 peptides |
8 spectra |
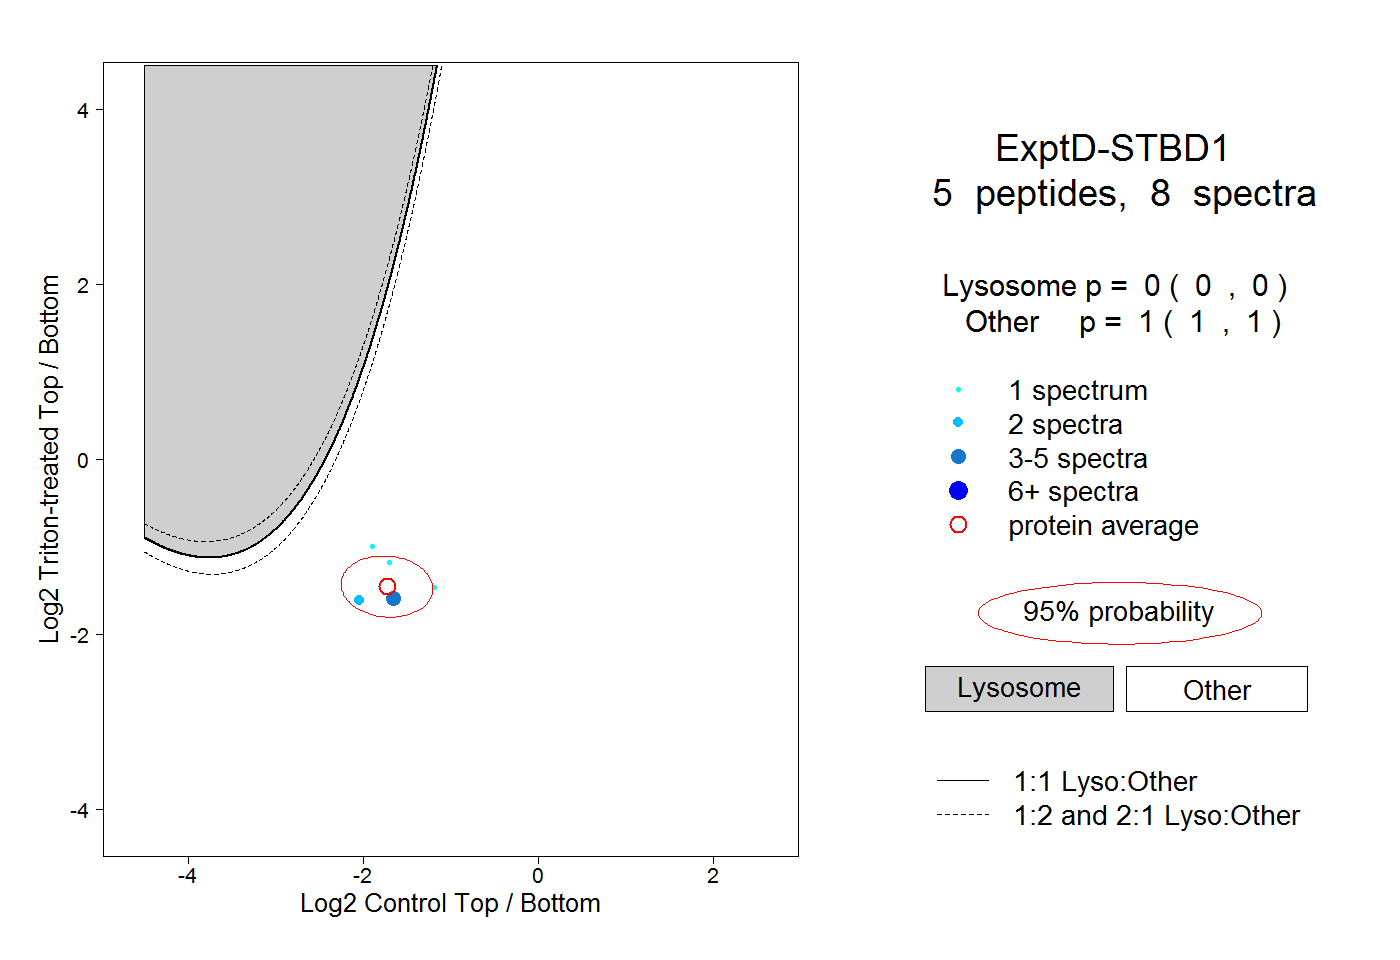 |
0.000 0.000 | 0.000 |
1.000 1.000 | 1.000 |