 3
3peptides
spectra
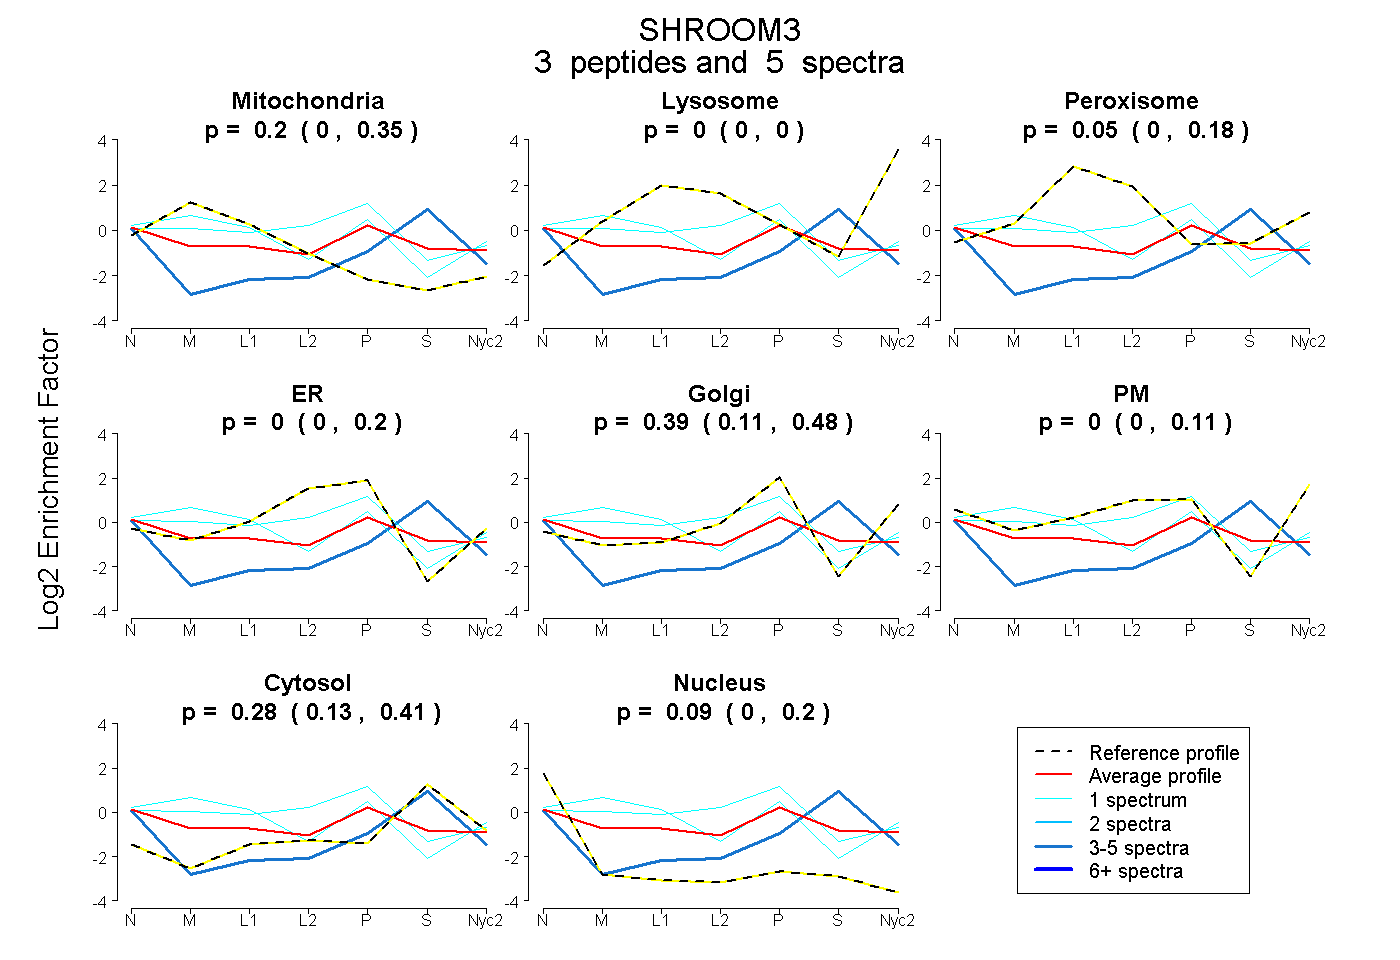
0.000 | 0.355
0.000 | 0.000
0.000 | 0.181
0.000 | 0.200
0.106 | 0.477
0.000 | 0.105
0.129 | 0.408
0.000 | 0.205
1peptide
spectrum
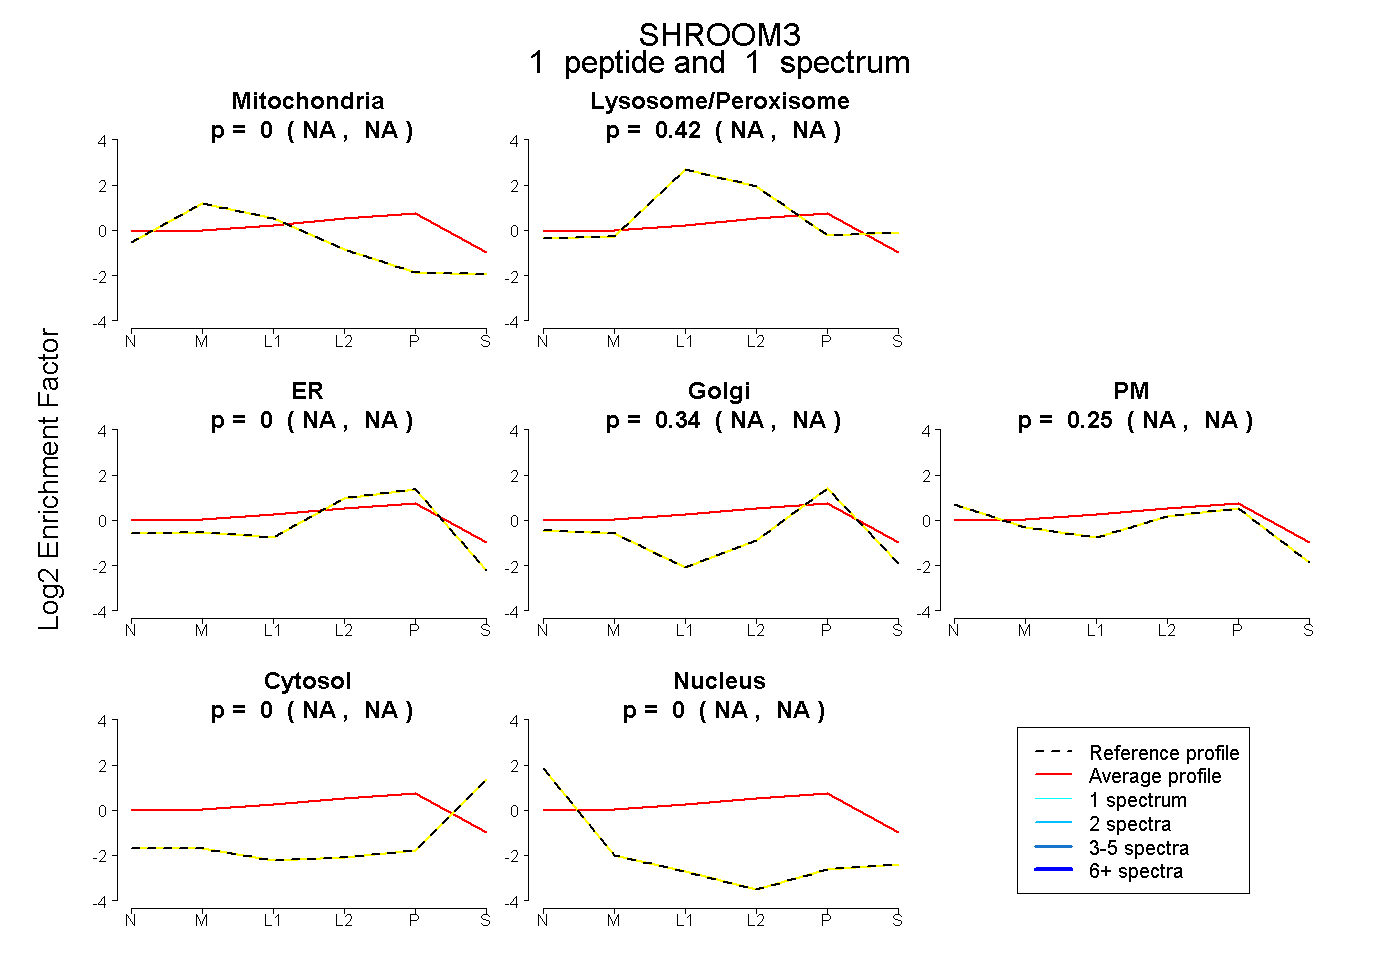
NA | NA
NA | NA
NA | NA
NA | NA
NA | NA
NA | NA
NA | NA
2peptides
spectra
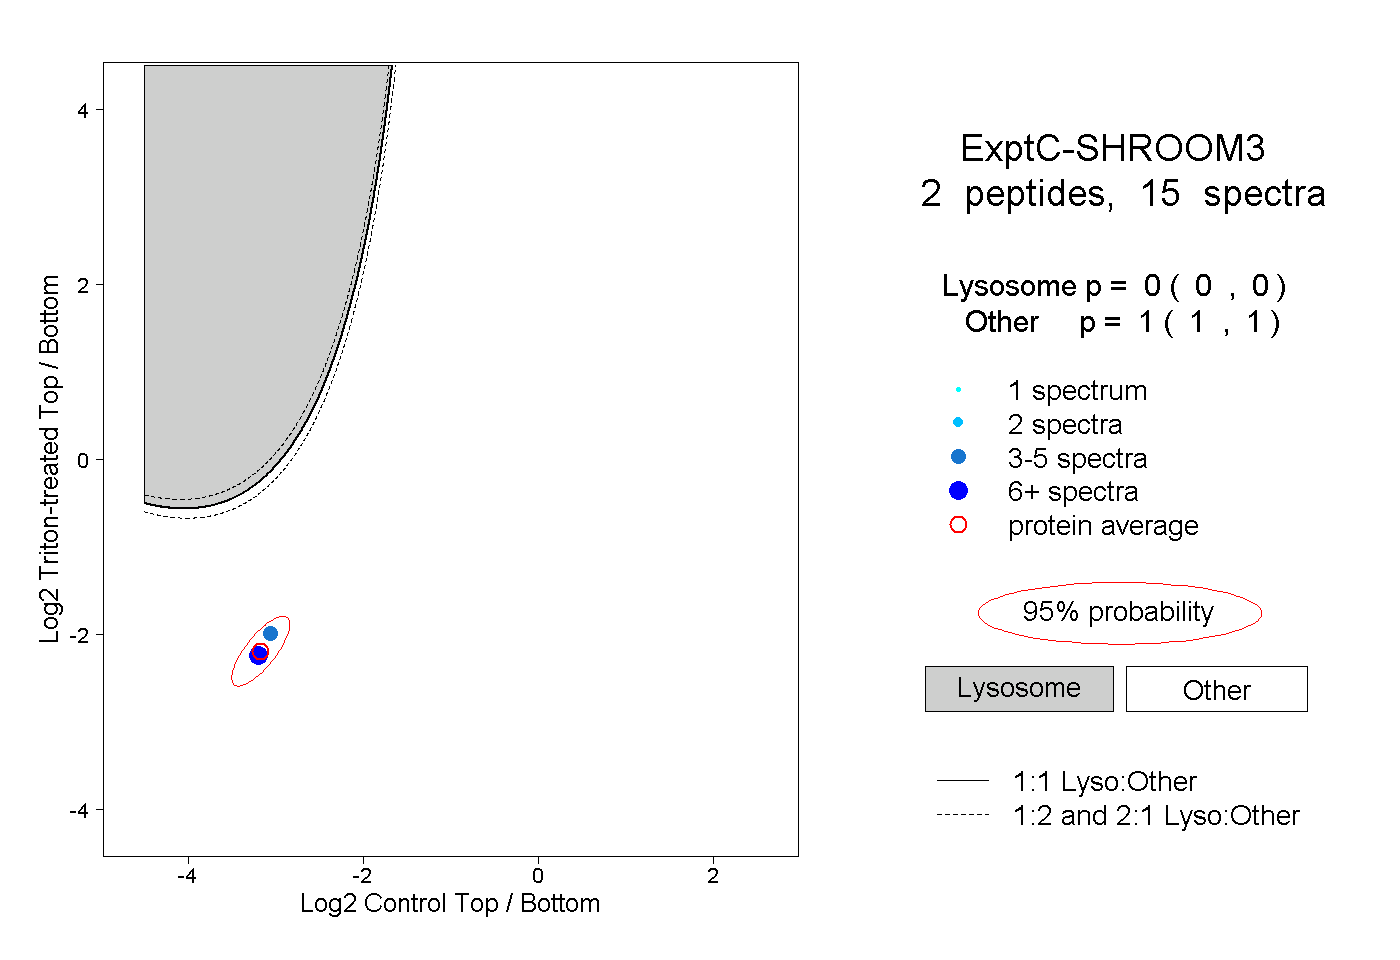
0.000 | 0.000
1.000 | 1.000