 3
3peptides
spectra
0.000 | 0.355
0.000 | 0.000
0.000 | 0.181
0.000 | 0.200
0.106 | 0.477
0.000 | 0.105
0.129 | 0.408
0.000 | 0.205
| Plot | Mito | Lyso | Perox | ER | Golgi | PM | Cytosol | Nucleus | |||||
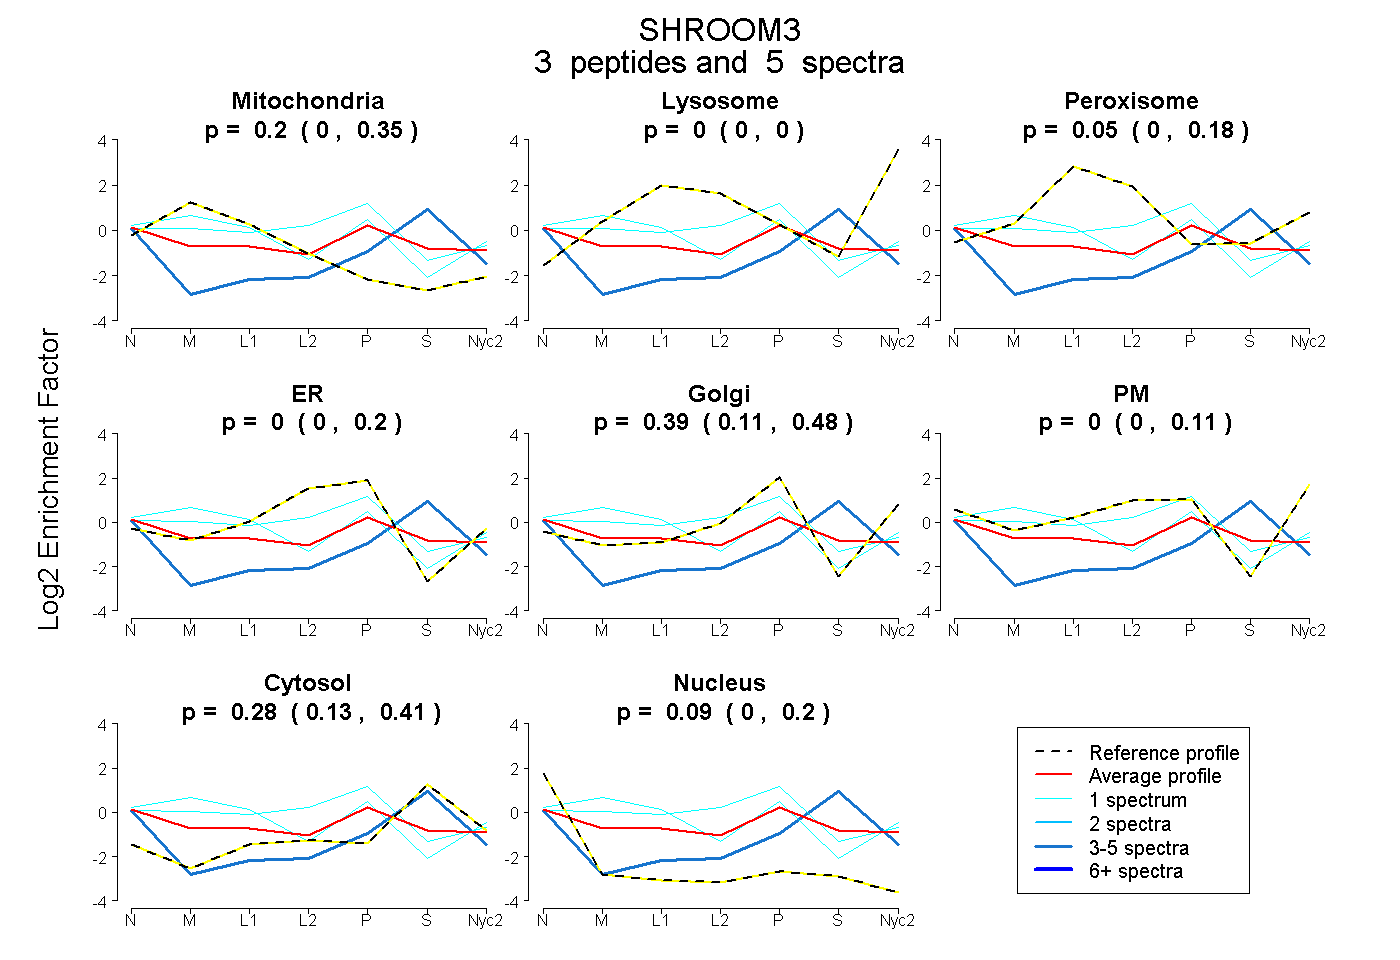
| Expt A |
3 peptides |
5 spectra |
|
0.197 0.000 | 0.355 |
0.000 0.000 | 0.000 |
0.046 0.000 | 0.181 |
0.000 0.000 | 0.200 |
0.393 0.106 | 0.477 |
0.000 0.000 | 0.105 |
0.279 0.129 | 0.408 |
0.085 0.000 | 0.205 |
| 1 spectrum, IEEGGK | 0.196 | 0.000 | 0.081 | 0.379 | 0.243 | 0.000 | 0.102 | 0.000 | ||
| 1 spectrum, WAHAVR | 0.485 | 0.000 | 0.003 | 0.000 | 0.484 | 0.027 | 0.000 | 0.000 | ||
| 3 spectra, DAGVLK | 0.000 | 0.000 | 0.000 | 0.000 | 0.000 | 0.000 | 0.764 | 0.236 |
| Plot | Mito | Lyso or Perox | ER | Golgi | PM | Cytosol | Nucleus | ||||||
| Expt B |
1 peptide |
1 spectrum |
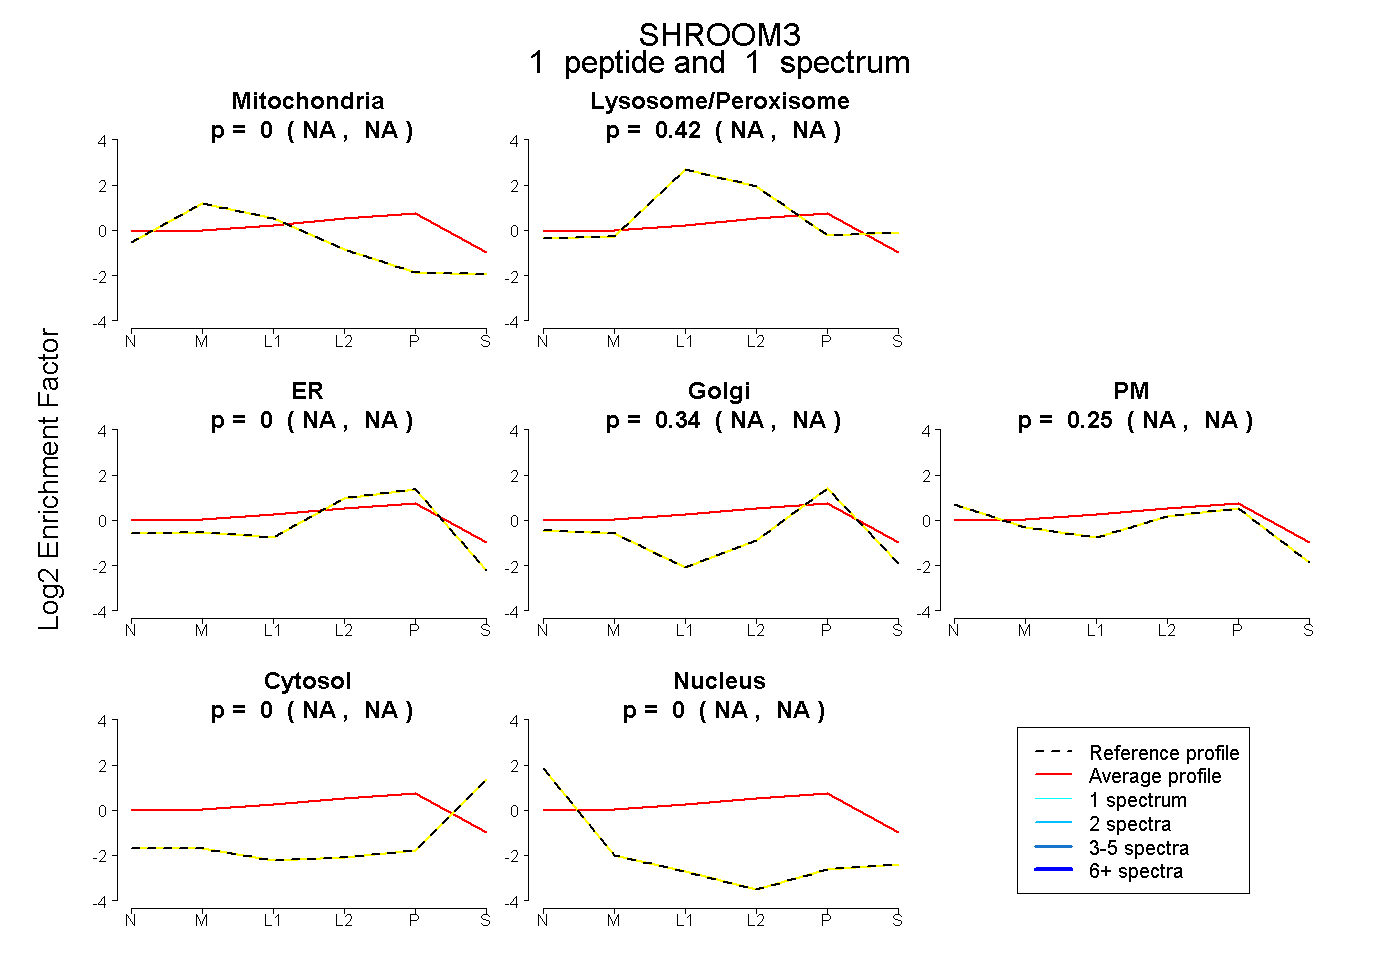 |
0.001 NA | NA |
0.415 NA | NA |
0.000 NA | NA |
0.337 NA | NA |
0.246 NA | NA |
0.000 NA | NA |
0.000 NA | NA |
|||
| Plot | Lyso | Other | |||||||||||
| Expt C |
2 peptides |
15 spectra |
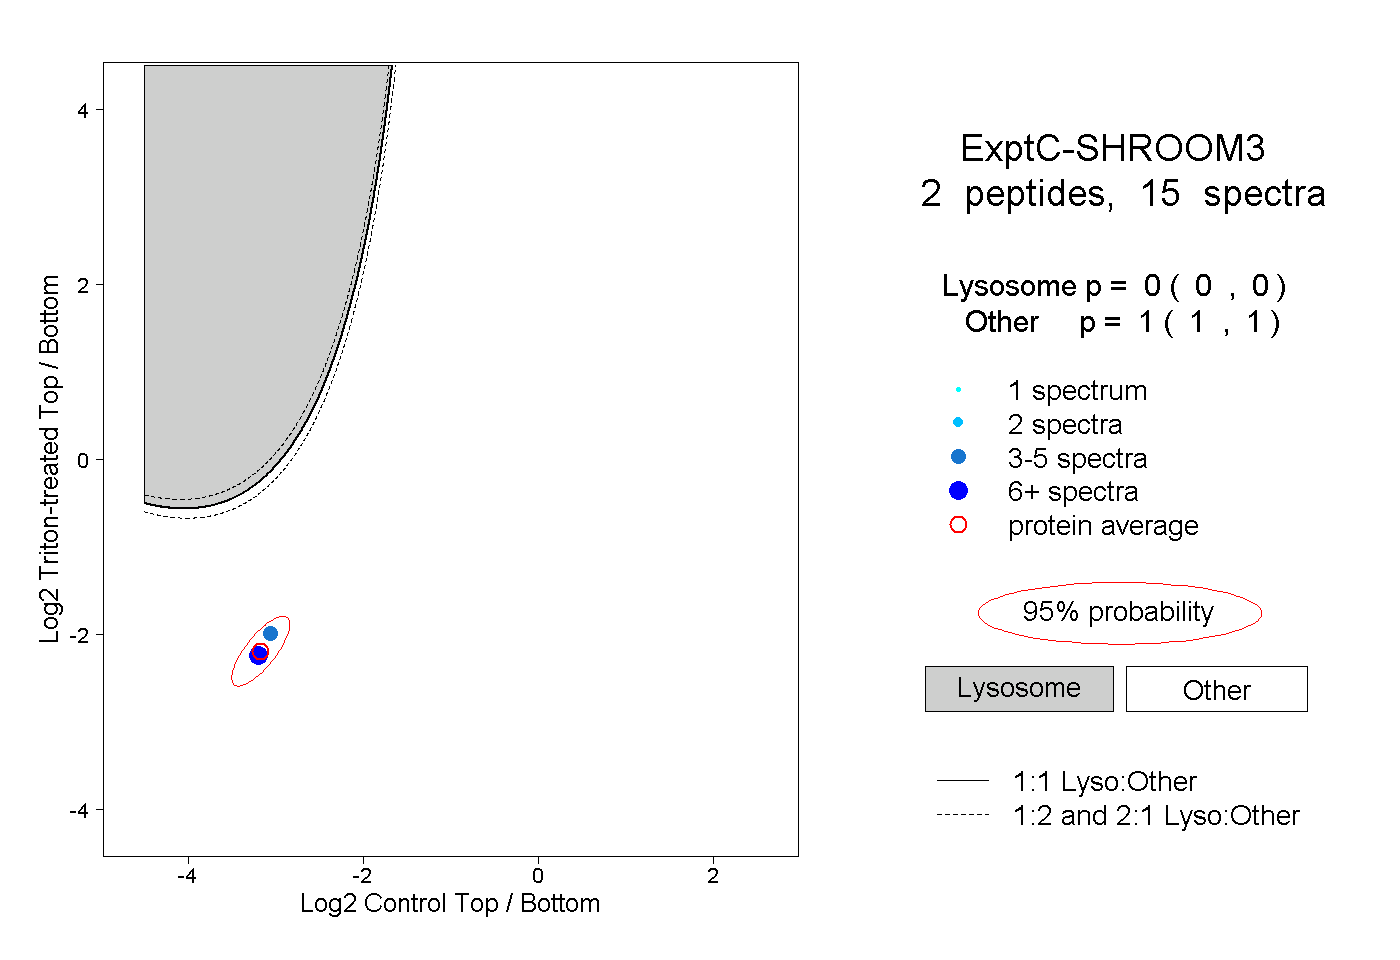 |
0.000 0.000 | 0.000 |
1.000 1.000 | 1.000 |