 5
5peptides
spectra
0.000 | 0.000
0.037 | 0.139
0.000 | 0.083
0.000 | 0.000
0.000 | 0.027
0.556 | 0.636
0.241 | 0.282
0.000 | 0.000
3peptides
spectra
0.000 | 0.000
1.000 | 1.000
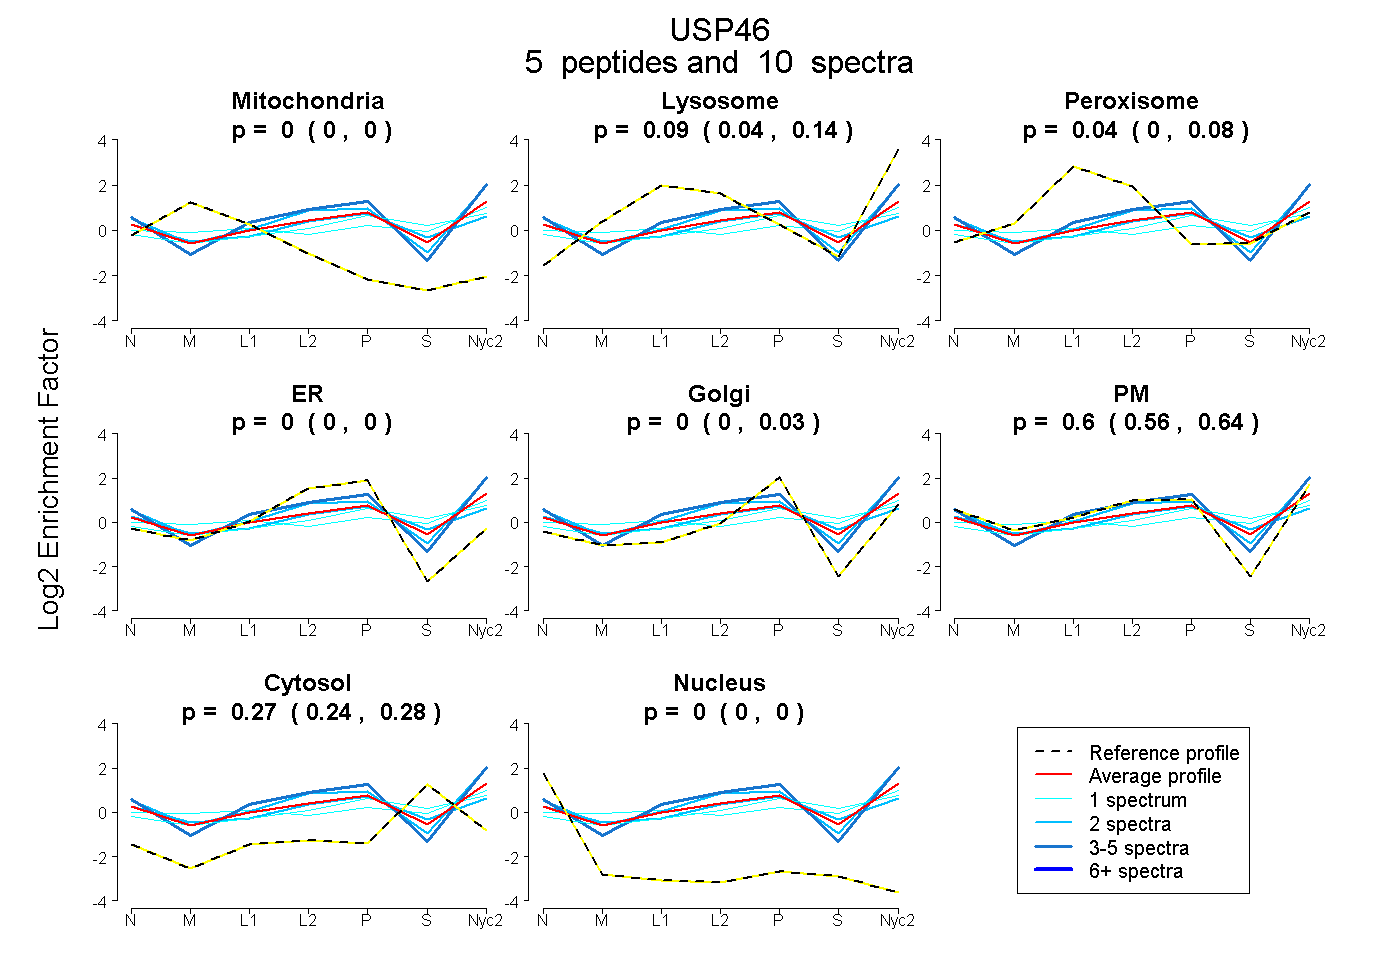
| Plot | Mito | Lyso | Perox | ER | Golgi | PM | Cytosol | Nucleus | |||||
| Expt A |
5 peptides |
10 spectra |
|
0.000 0.000 | 0.000 |
0.094 0.037 | 0.139 |
0.037 0.000 | 0.083 |
0.000 0.000 | 0.000 |
0.000 0.000 | 0.027 |
0.604 0.556 | 0.636 |
0.265 0.241 | 0.282 |
0.000 0.000 | 0.000 |
||
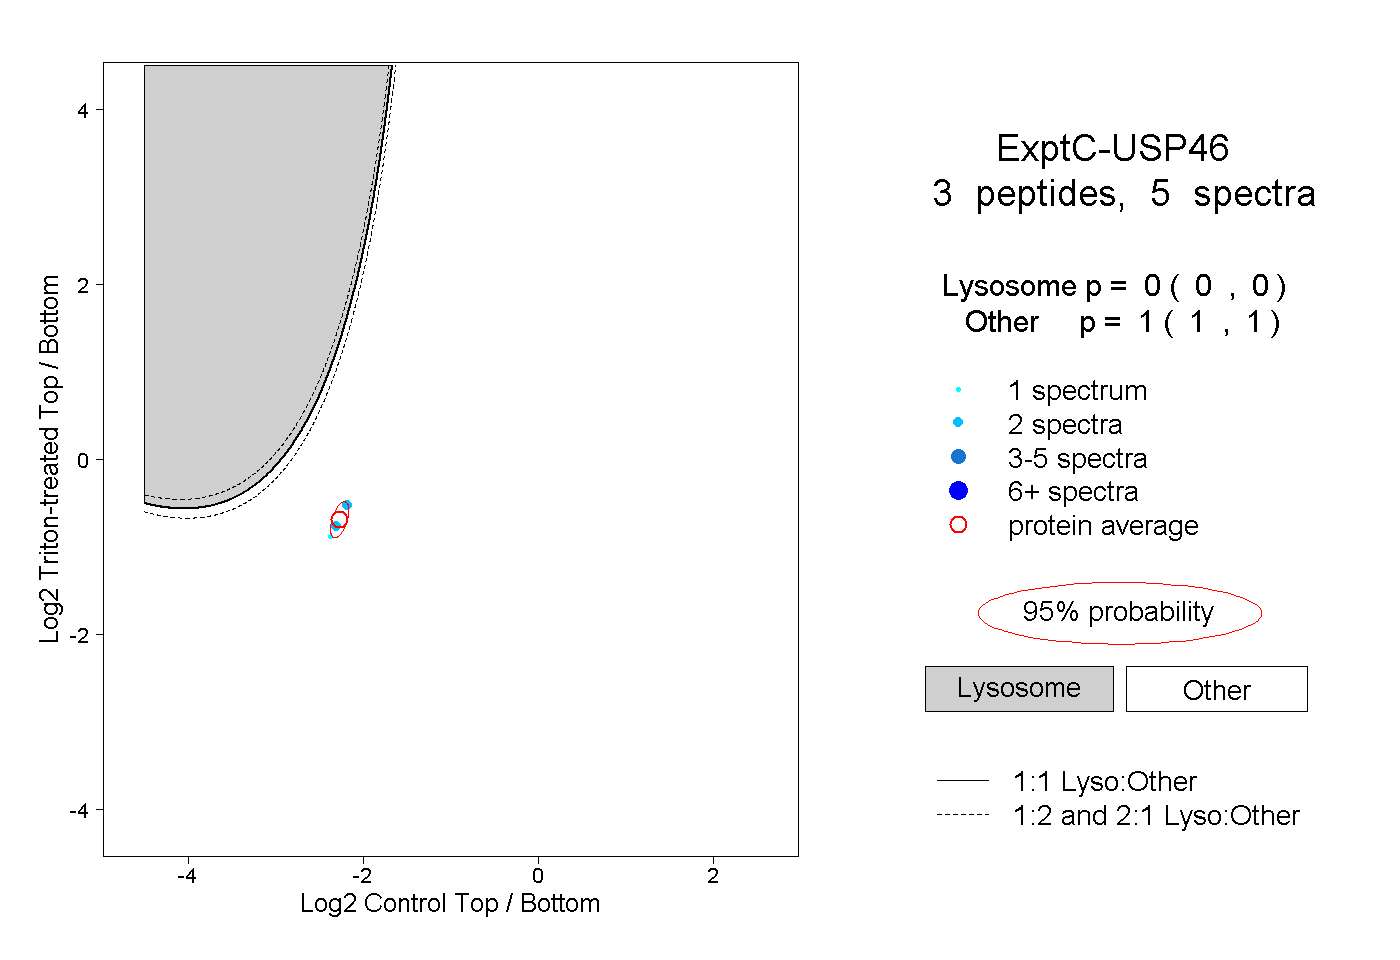
| Plot | Lyso | Other | |||||||||||
| Expt C |
3 peptides |
5 spectra |
|
0.000 0.000 | 0.000 |
1.000 1.000 | 1.000 |