 5
5peptides
spectra
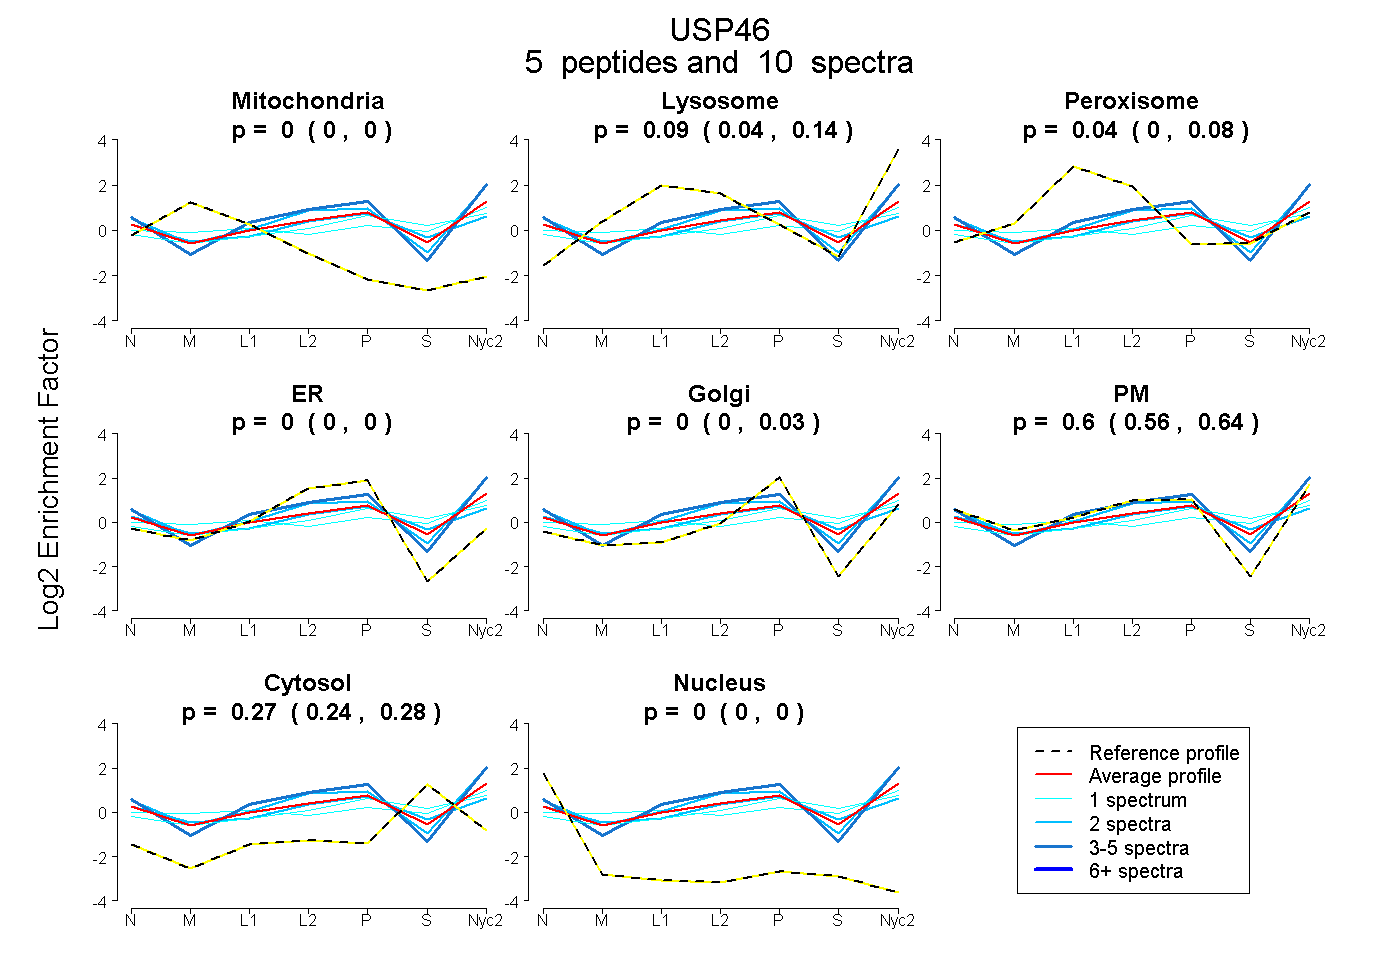
0.000 | 0.000
0.037 | 0.139
0.000 | 0.083
0.000 | 0.000
0.000 | 0.027
0.556 | 0.636
0.241 | 0.282
0.000 | 0.000
| Plot | Mito | Lyso | Perox | ER | Golgi | PM | Cytosol | Nucleus | |||||
| Expt A |
5 peptides |
10 spectra |
|
0.000 0.000 | 0.000 |
0.094 0.037 | 0.139 |
0.037 0.000 | 0.083 |
0.000 0.000 | 0.000 |
0.000 0.000 | 0.027 |
0.604 0.556 | 0.636 |
0.265 0.241 | 0.282 |
0.000 0.000 | 0.000 |
| 1 spectrum, ENVLAYK | 0.032 | 0.139 | 0.100 | 0.000 | 0.000 | 0.387 | 0.342 | 0.000 | ||
| 4 spectra, VVFPLELR | 0.000 | 0.109 | 0.000 | 0.000 | 0.000 | 0.793 | 0.097 | 0.000 | ||
| 1 spectrum, YYCETCCSK | 0.000 | 0.091 | 0.113 | 0.000 | 0.139 | 0.280 | 0.376 | 0.000 | ||
| 2 spectra, LFNTSSDAVNLDR | 0.000 | 0.150 | 0.000 | 0.000 | 0.000 | 0.709 | 0.141 | 0.000 | ||
| 2 spectra, GHYITIVK | 0.000 | 0.000 | 0.120 | 0.000 | 0.075 | 0.501 | 0.304 | 0.000 |
| Plot | Lyso | Other | |||||||||||
| Expt C |
3 peptides |
5 spectra |
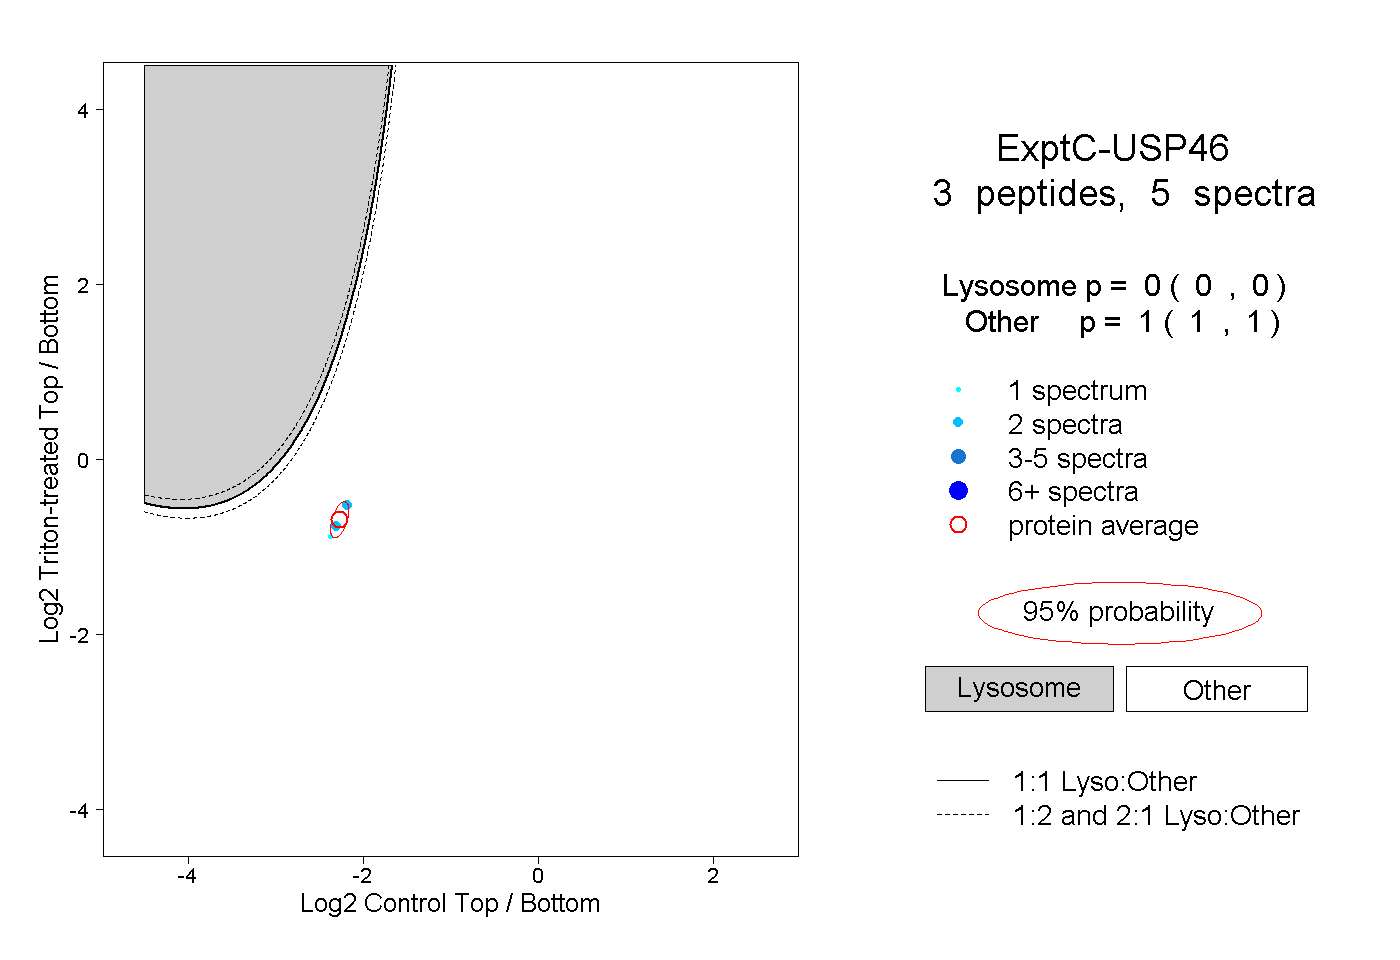 |
0.000 0.000 | 0.000 |
1.000 1.000 | 1.000 |