 8
8peptides
spectra
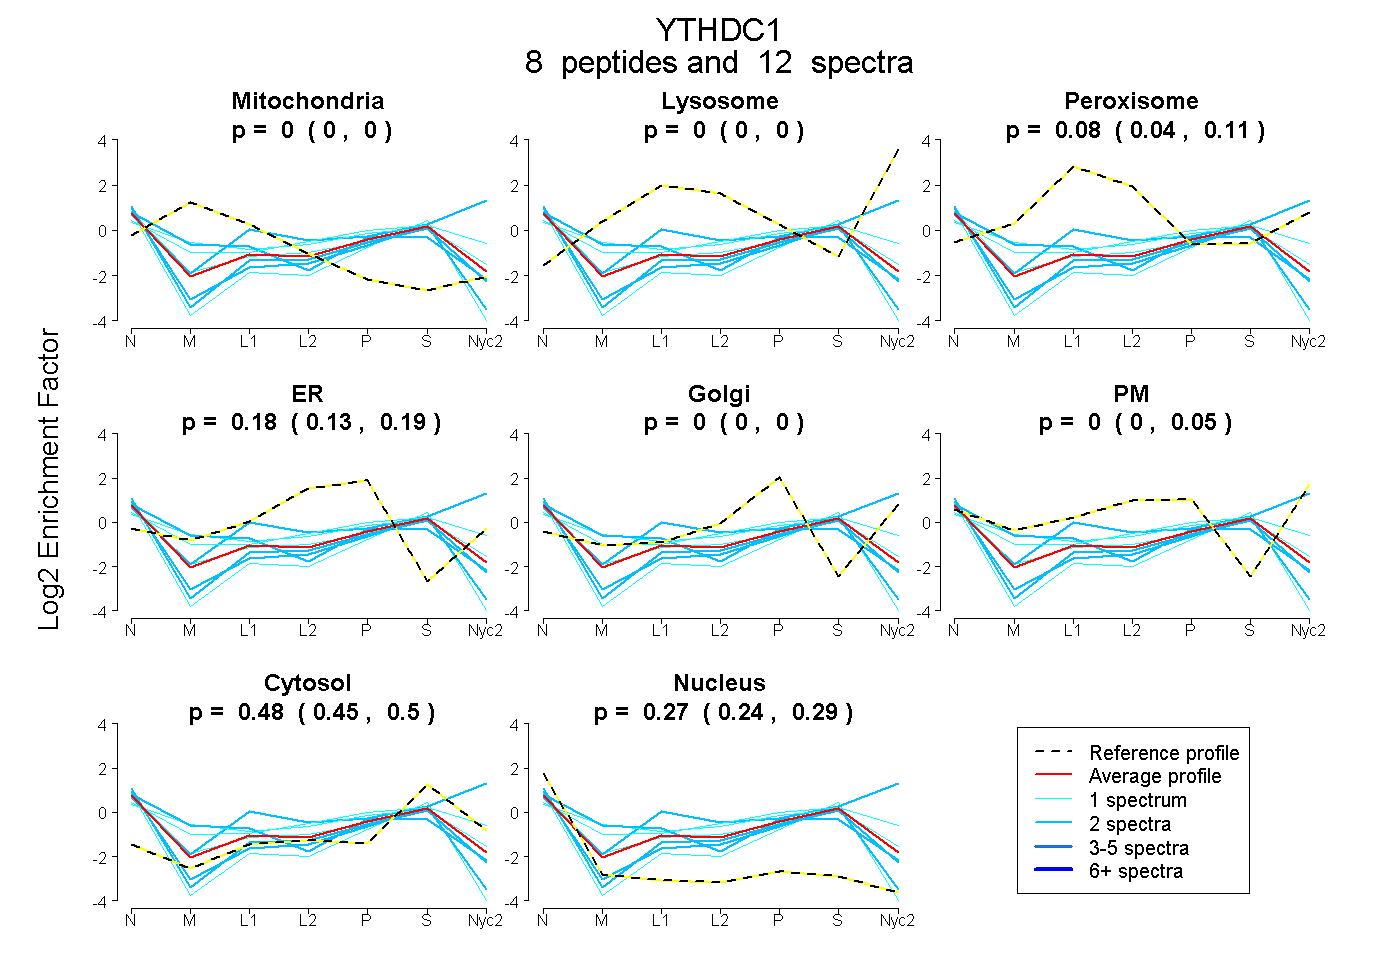
0.000 | 0.000
0.000 | 0.000
0.042 | 0.105
0.130 | 0.193
0.000 | 0.000
0.000 | 0.046
0.449 | 0.499
0.243 | 0.288
1peptide
spectra
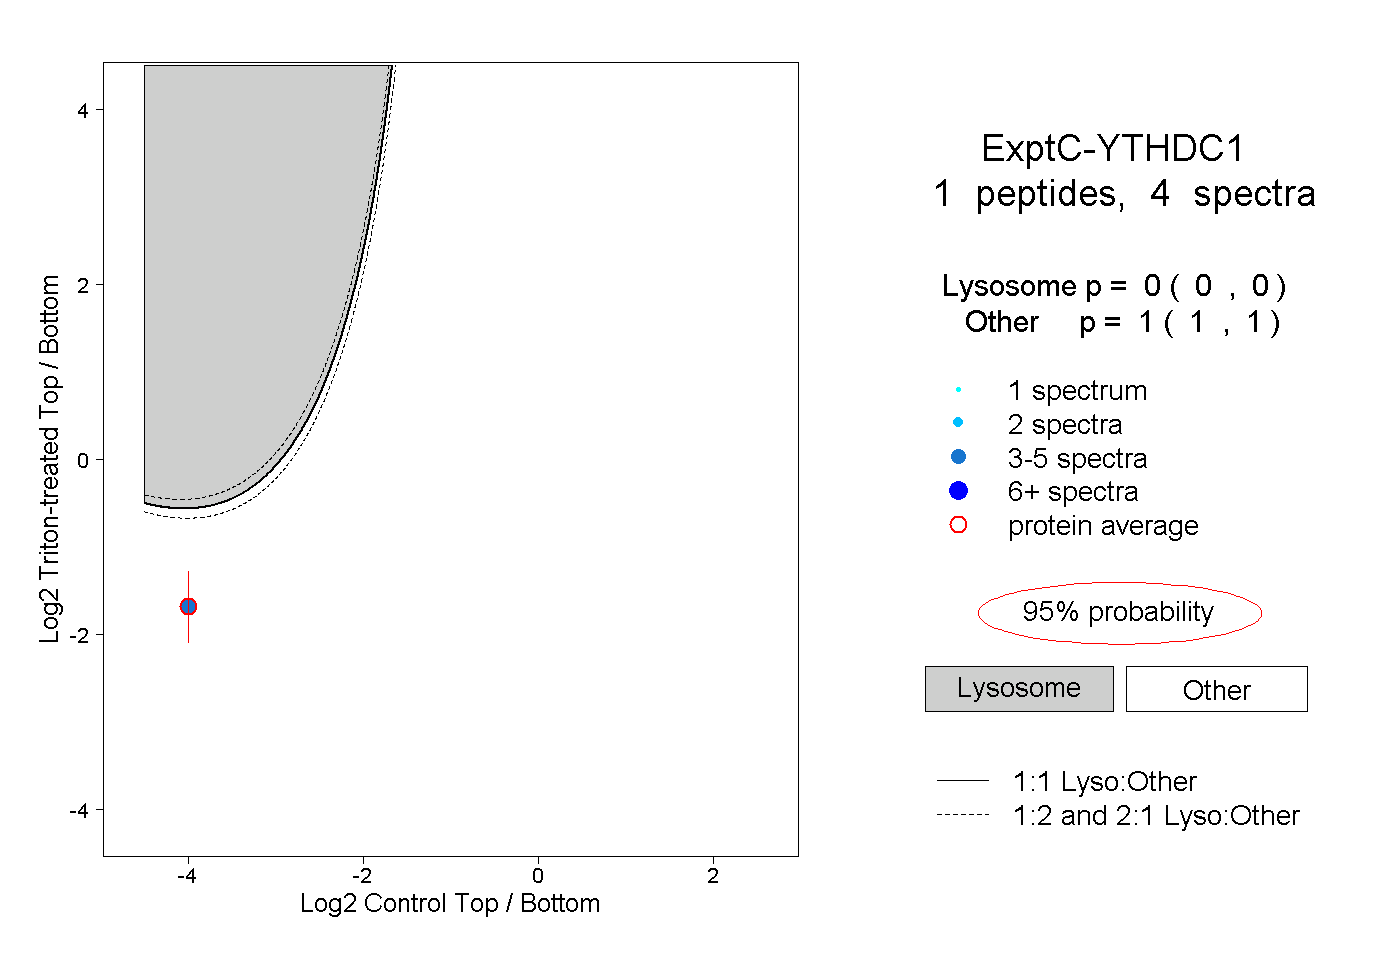
0.000 | 0.000
1.000 | 1.000
| Plot | Mito | Lyso | Perox | ER | Golgi | PM | Cytosol | Nucleus | |||||
| Expt A |
8 peptides |
12 spectra |
|
0.000 0.000 | 0.000 |
0.000 0.000 | 0.000 |
0.078 0.042 | 0.105 |
0.177 0.130 | 0.193 |
0.000 0.000 | 0.000 |
0.000 0.000 | 0.046 |
0.476 0.449 | 0.499 |
0.269 0.243 | 0.288 |
||
| Plot | Lyso | Other | |||||||||||
| Expt C |
1 peptide |
4 spectra |
|
0.000 0.000 | 0.000 |
1.000 1.000 | 1.000 |