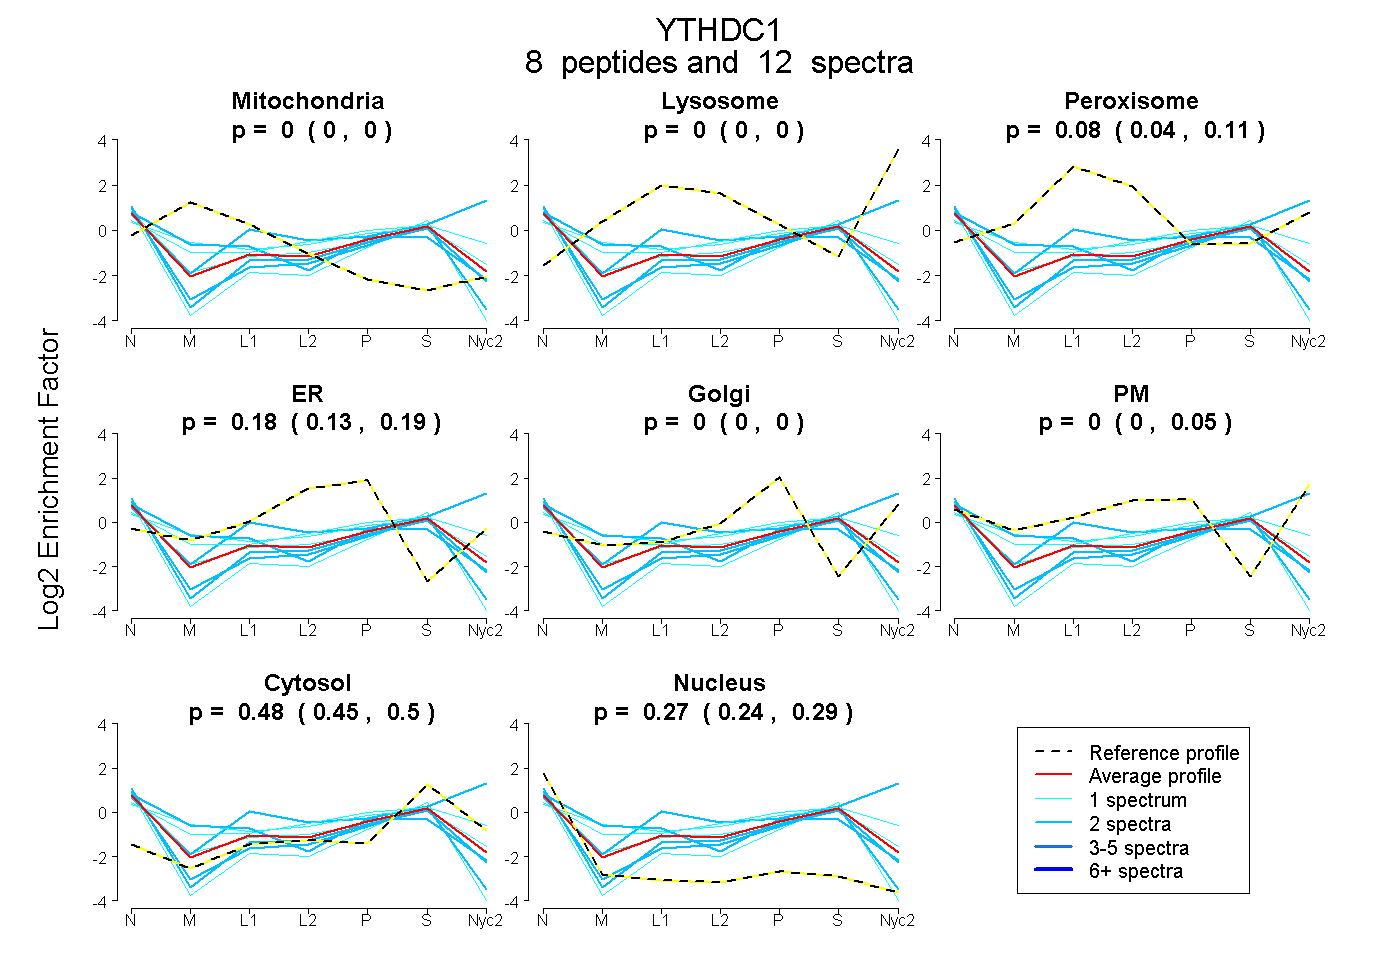
 8
8peptides
spectra
0.000 | 0.000
0.000 | 0.000
0.042 | 0.105
0.130 | 0.193
0.000 | 0.000
0.000 | 0.046
0.449 | 0.499
0.243 | 0.288
| Plot | Mito | Lyso | Perox | ER | Golgi | PM | Cytosol | Nucleus | |||||
| Expt A |
8 peptides |
12 spectra |
|
0.000 0.000 | 0.000 |
0.000 0.000 | 0.000 |
0.078 0.042 | 0.105 |
0.177 0.130 | 0.193 |
0.000 0.000 | 0.000 |
0.000 0.000 | 0.046 |
0.476 0.449 | 0.499 |
0.269 0.243 | 0.288 |
| 2 spectra, VDDFLR | 0.000 | 0.000 | 0.000 | 0.145 | 0.000 | 0.000 | 0.507 | 0.348 | ||
| 2 spectra, LSSSSSR | 0.000 | 0.059 | 0.025 | 0.000 | 0.000 | 0.429 | 0.487 | 0.000 | ||
| 1 spectrum, VHDYDMR | 0.025 | 0.000 | 0.027 | 0.059 | 0.000 | 0.312 | 0.499 | 0.077 | ||
| 2 spectra, IDWICR | 0.000 | 0.000 | 0.000 | 0.083 | 0.000 | 0.000 | 0.483 | 0.435 | ||
| 1 spectrum, GISPIVFDR | 0.000 | 0.000 | 0.000 | 0.000 | 0.000 | 0.000 | 0.512 | 0.488 | ||
| 1 spectrum, MLGGVFK | 0.203 | 0.000 | 0.028 | 0.250 | 0.000 | 0.000 | 0.457 | 0.061 | ||
| 2 spectra, TQAVVSGR | 0.261 | 0.000 | 0.044 | 0.065 | 0.089 | 0.000 | 0.323 | 0.218 | ||
| 1 spectrum, FQGFAR | 0.000 | 0.000 | 0.098 | 0.166 | 0.000 | 0.000 | 0.462 | 0.275 |
| Plot | Lyso | Other | |||||||||||
| Expt C |
1 peptide |
4 spectra |
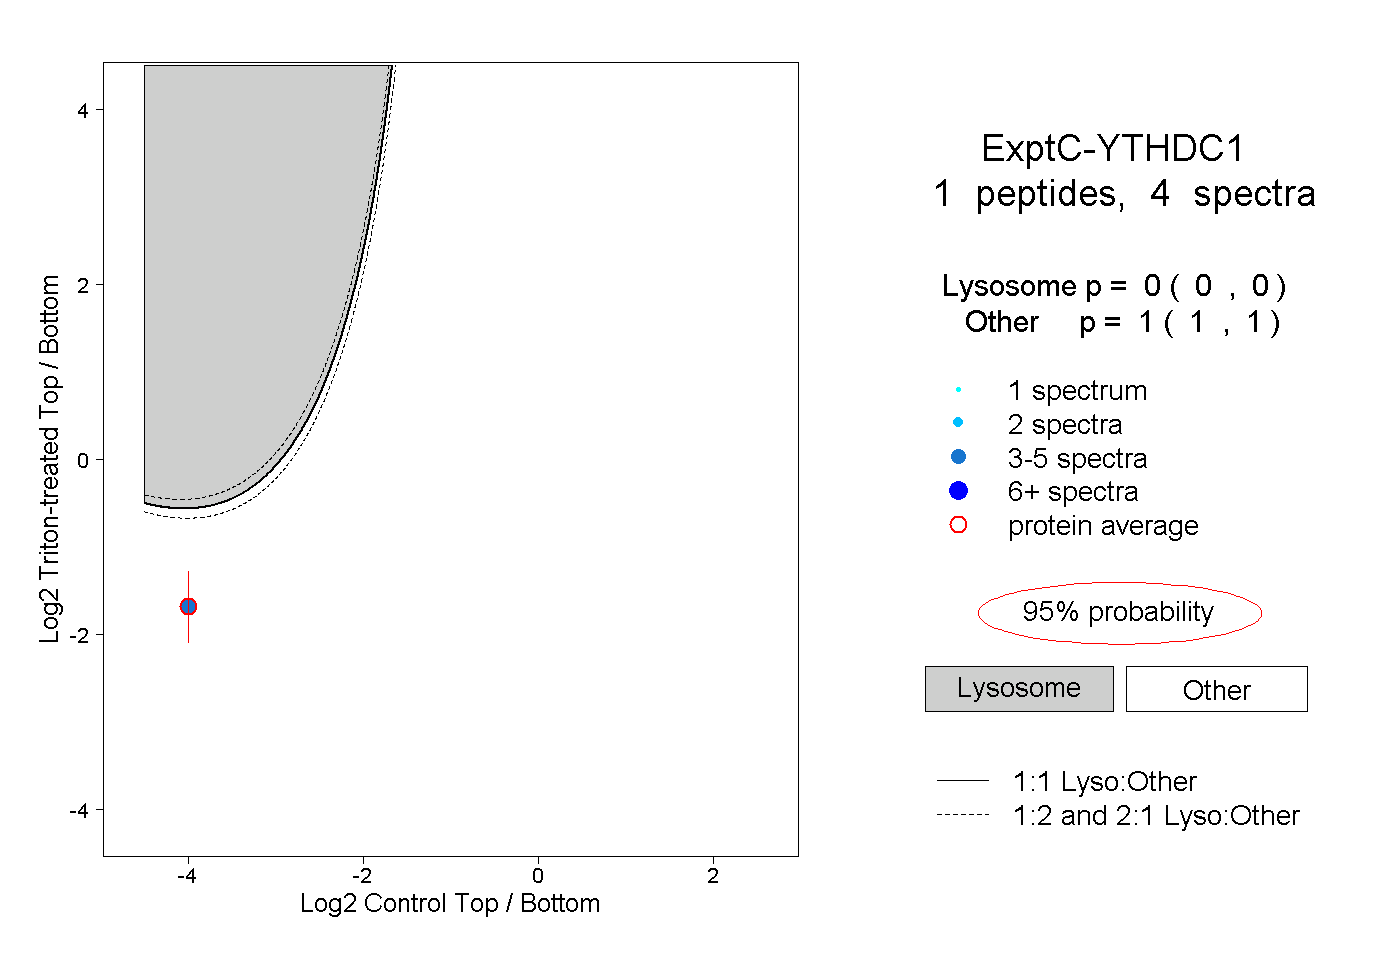 |
0.000 0.000 | 0.000 |
1.000 1.000 | 1.000 |