 18
18peptides
spectra
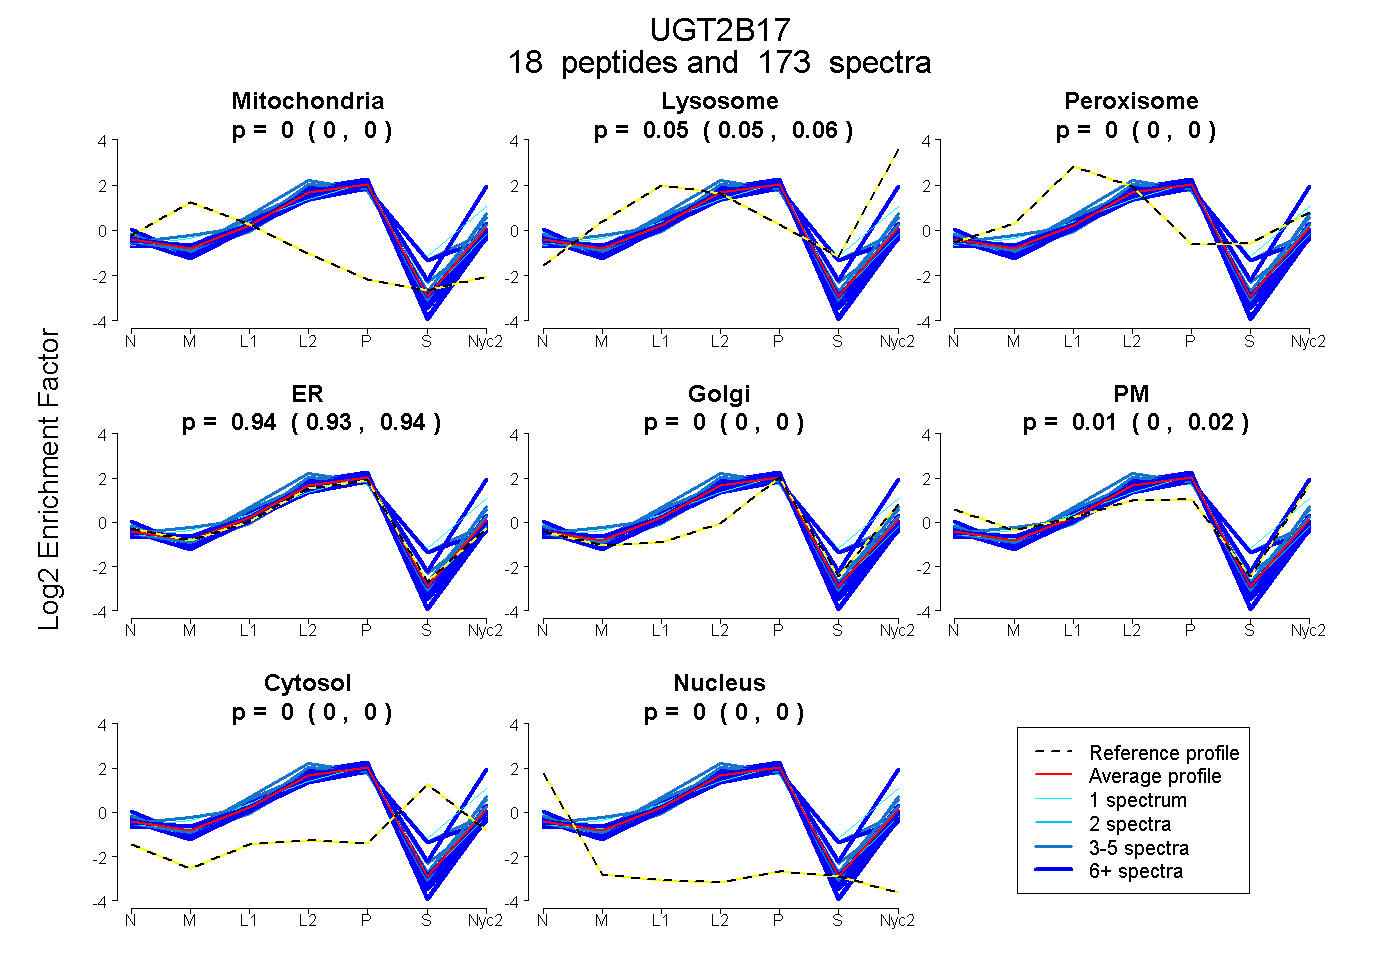
0.000 | 0.000
0.049 | 0.056
0.000 | 0.000
0.931 | 0.943
0.000 | 0.000
0.002 | 0.015
0.000 | 0.000
0.000 | 0.000
13peptides
spectra
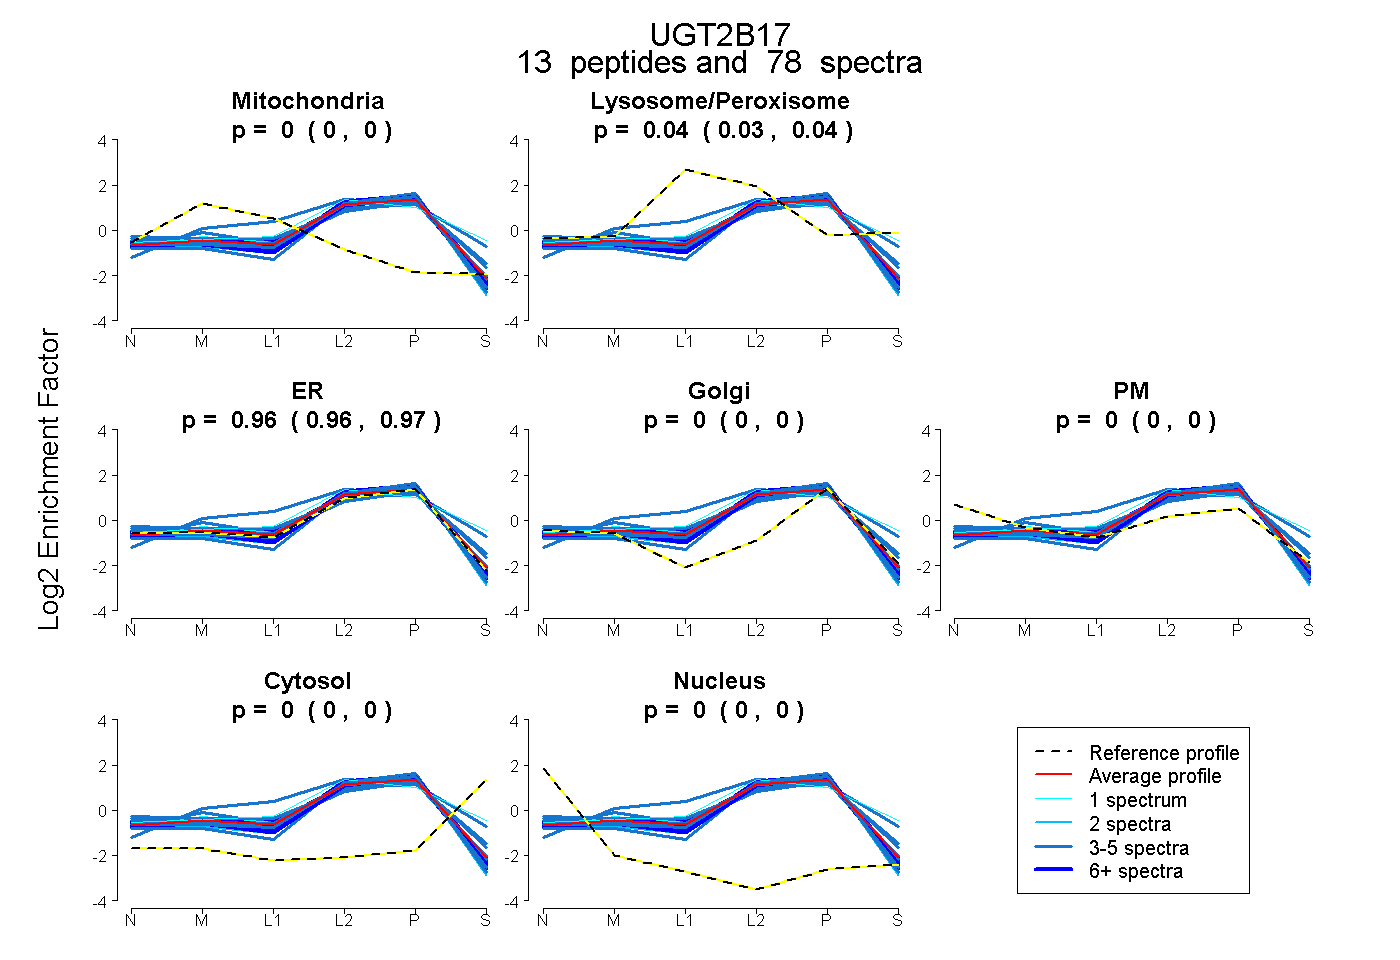
0.000 | 0.000
0.033 | 0.043
0.956 | 0.966
0.000 | 0.000
0.000 | 0.000
0.000 | 0.000
0.000 | 0.000
15peptides
spectra
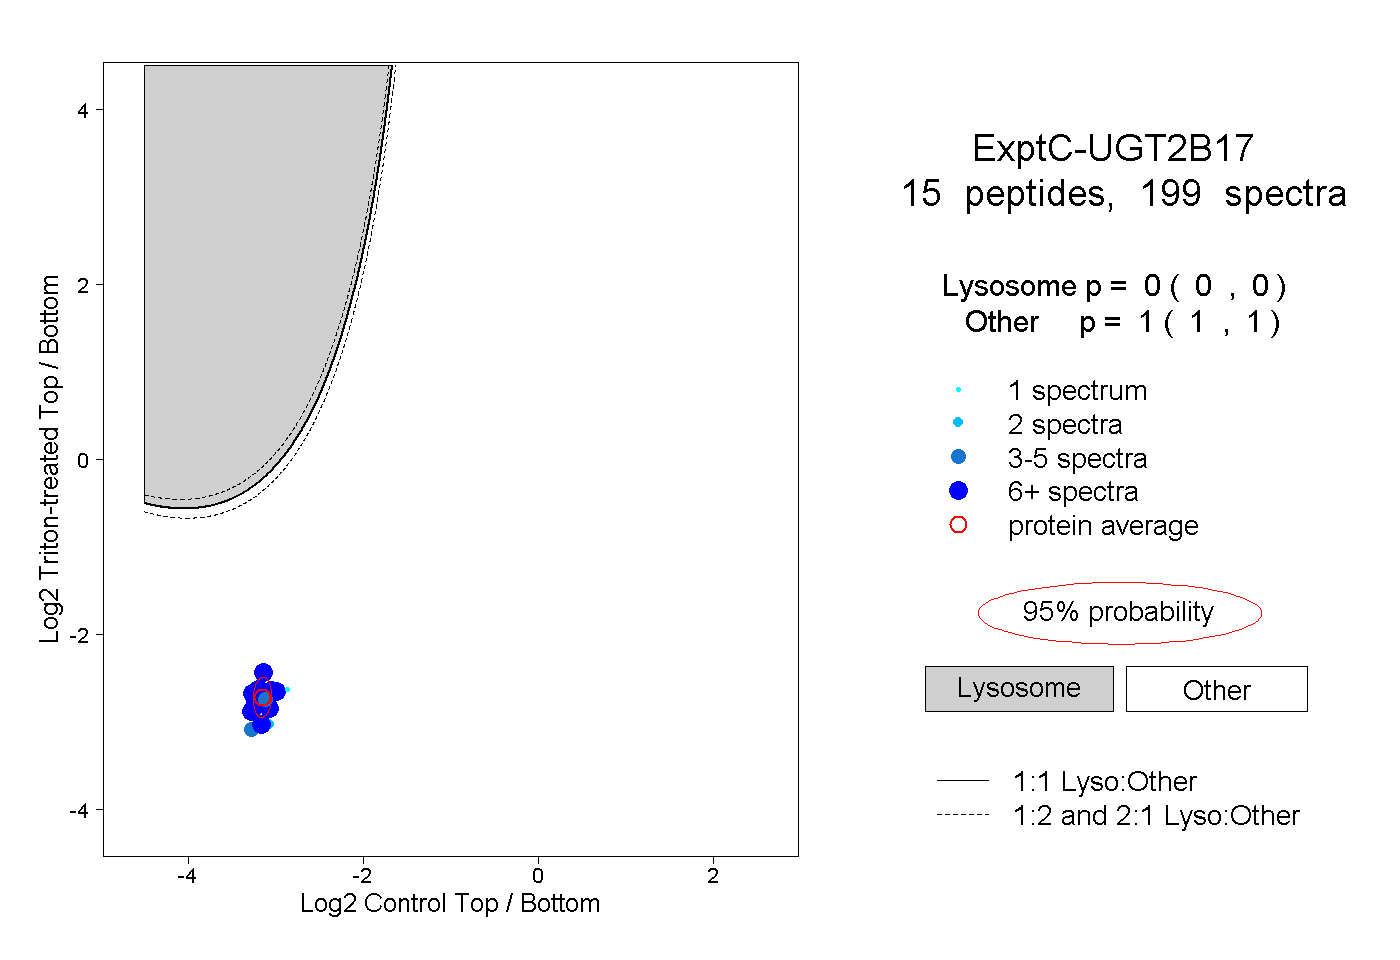
0.000 | 0.000
1.000 | 1.000
6peptides
spectra
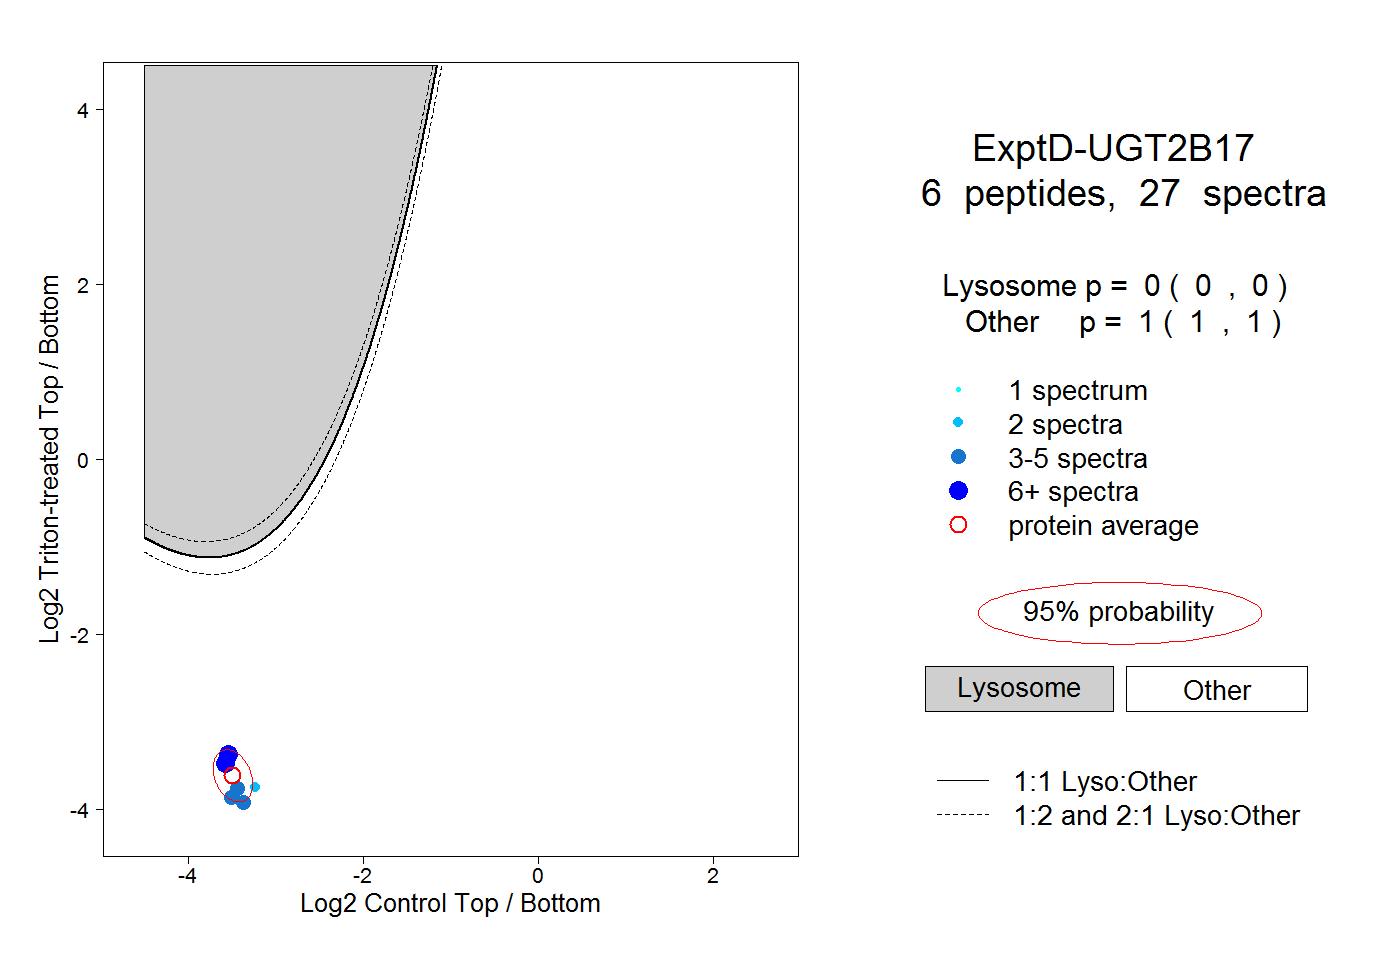
0.000 | 0.000
1.000 | 1.000