 15
15peptides
spectra
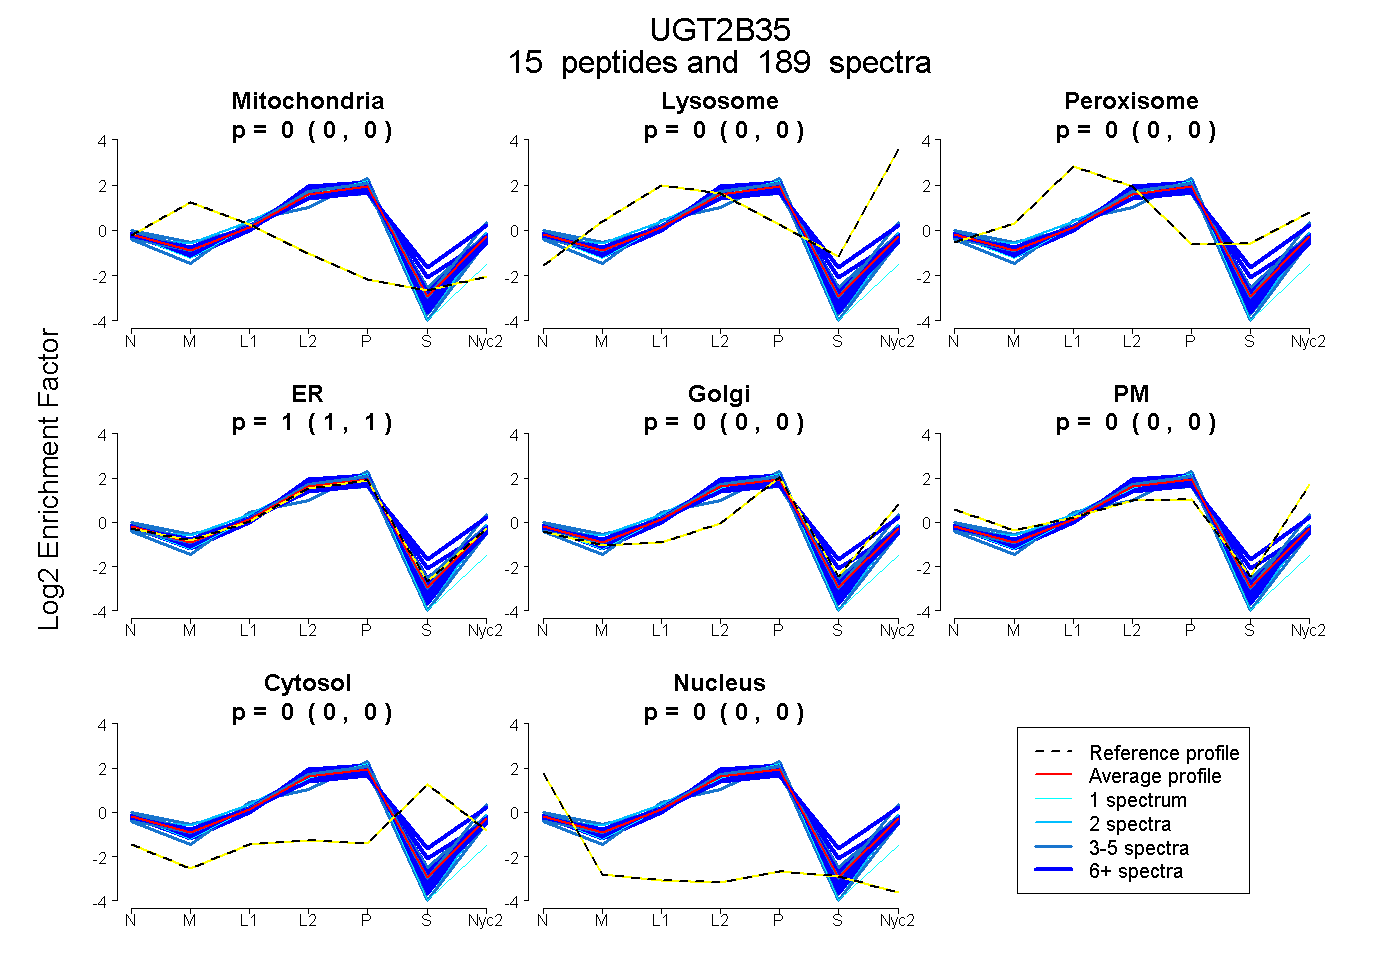
0.000 | 0.000
0.000 | 0.000
0.000 | 0.000
1.000 | 1.000
0.000 | 0.000
0.000 | 0.000
0.000 | 0.000
0.000 | 0.000
15peptides
spectra
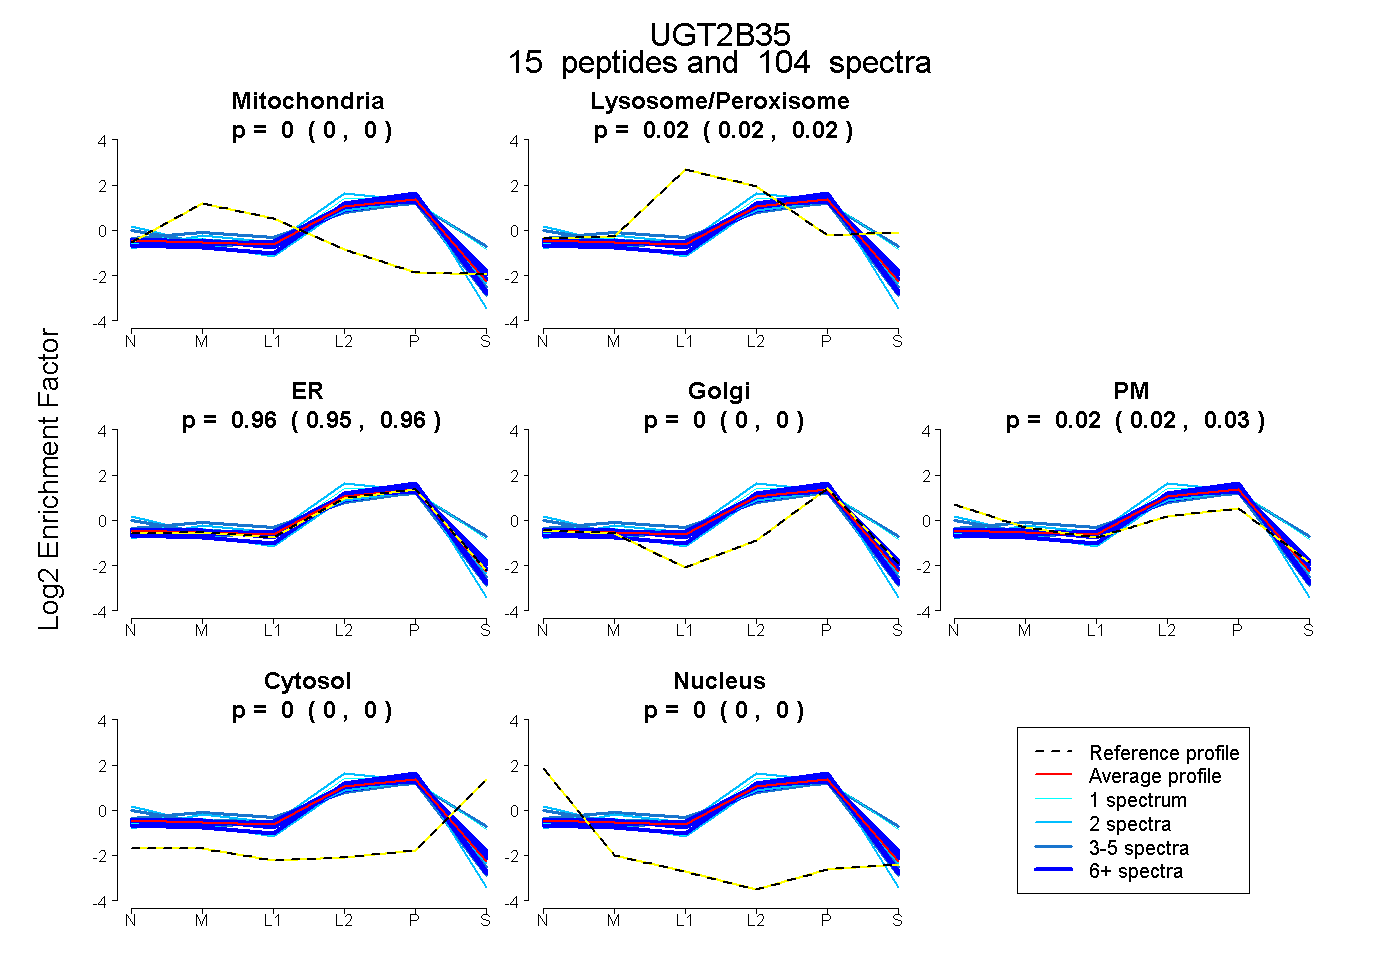
0.000 | 0.000
0.016 | 0.023
0.950 | 0.964
0.000 | 0.000
0.017 | 0.028
0.000 | 0.000
0.000 | 0.000
13peptides
spectra
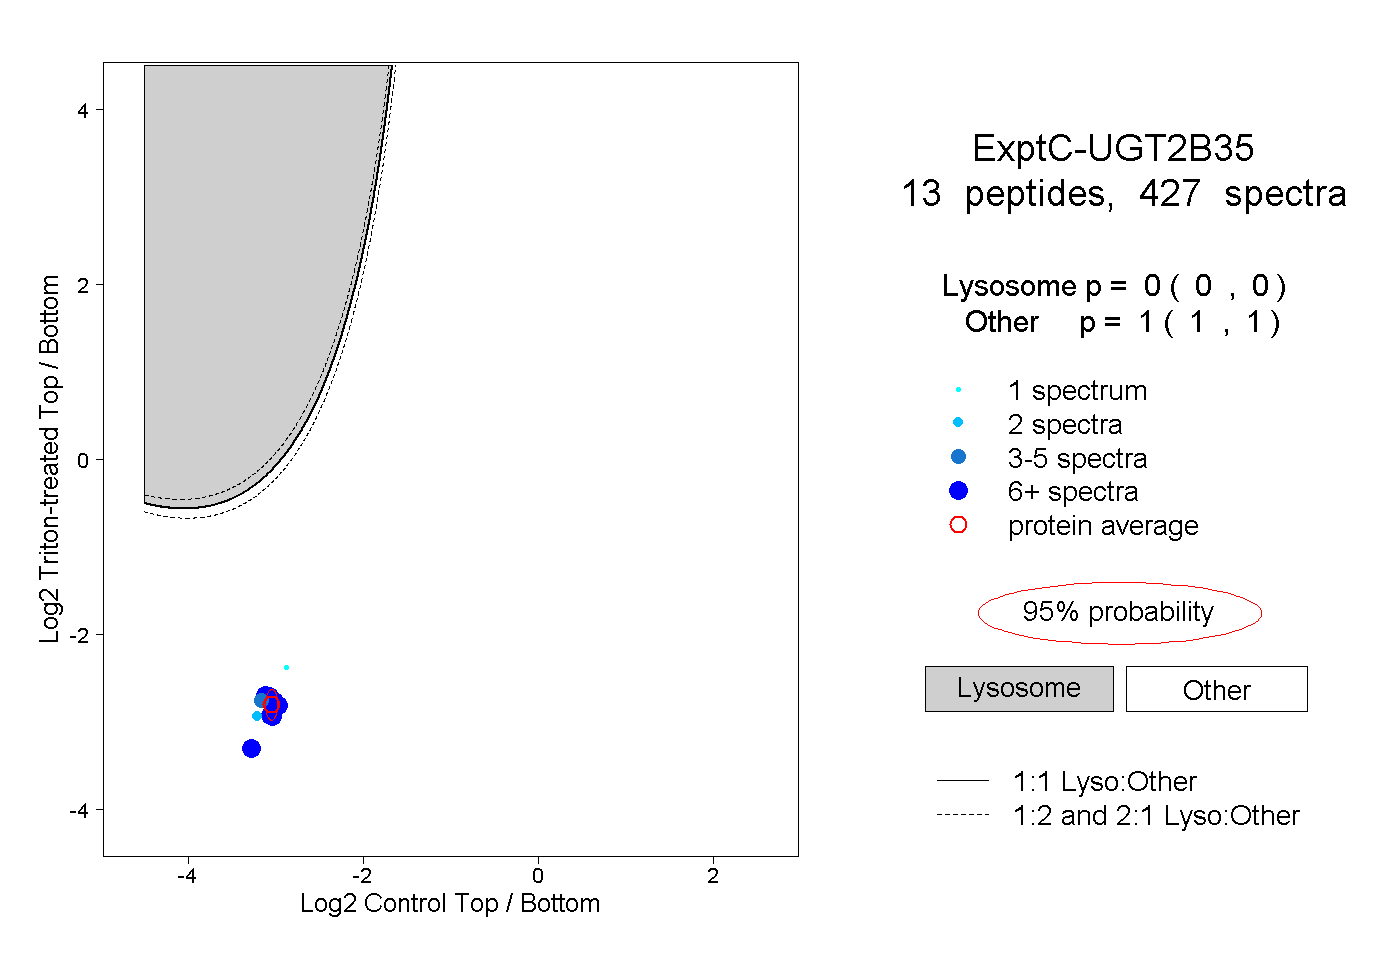
0.000 | 0.000
1.000 | 1.000
8peptides
spectra
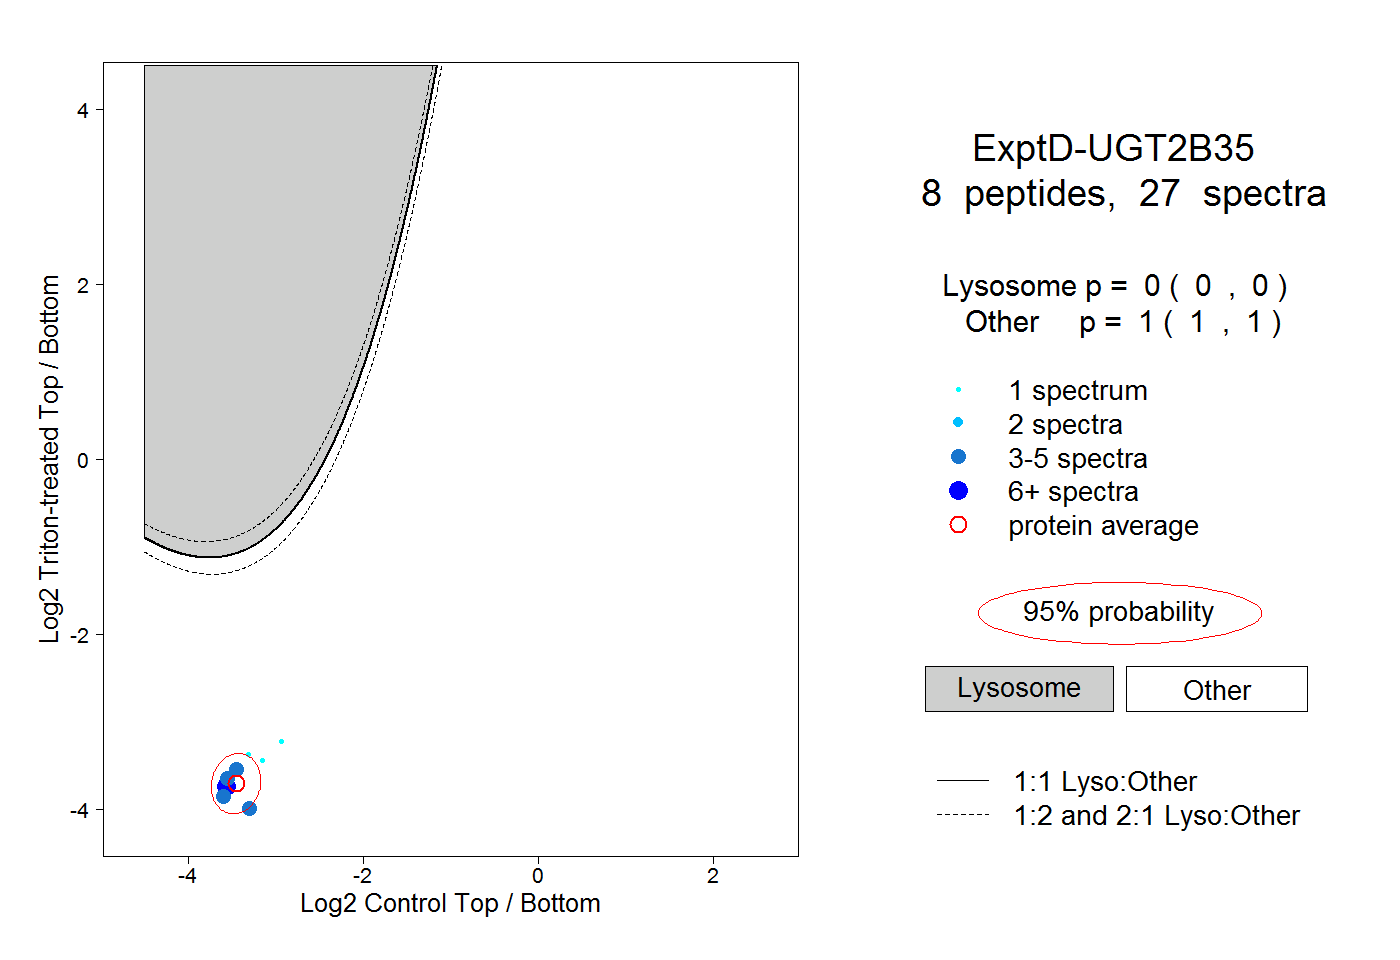
0.000 | 0.000
1.000 | 1.000