 15
15peptides
spectra
0.000 | 0.000
0.000 | 0.000
0.000 | 0.000
1.000 | 1.000
0.000 | 0.000
0.000 | 0.000
0.000 | 0.000
0.000 | 0.000
| Plot | Mito | Lyso | Perox | ER | Golgi | PM | Cytosol | Nucleus | |||||
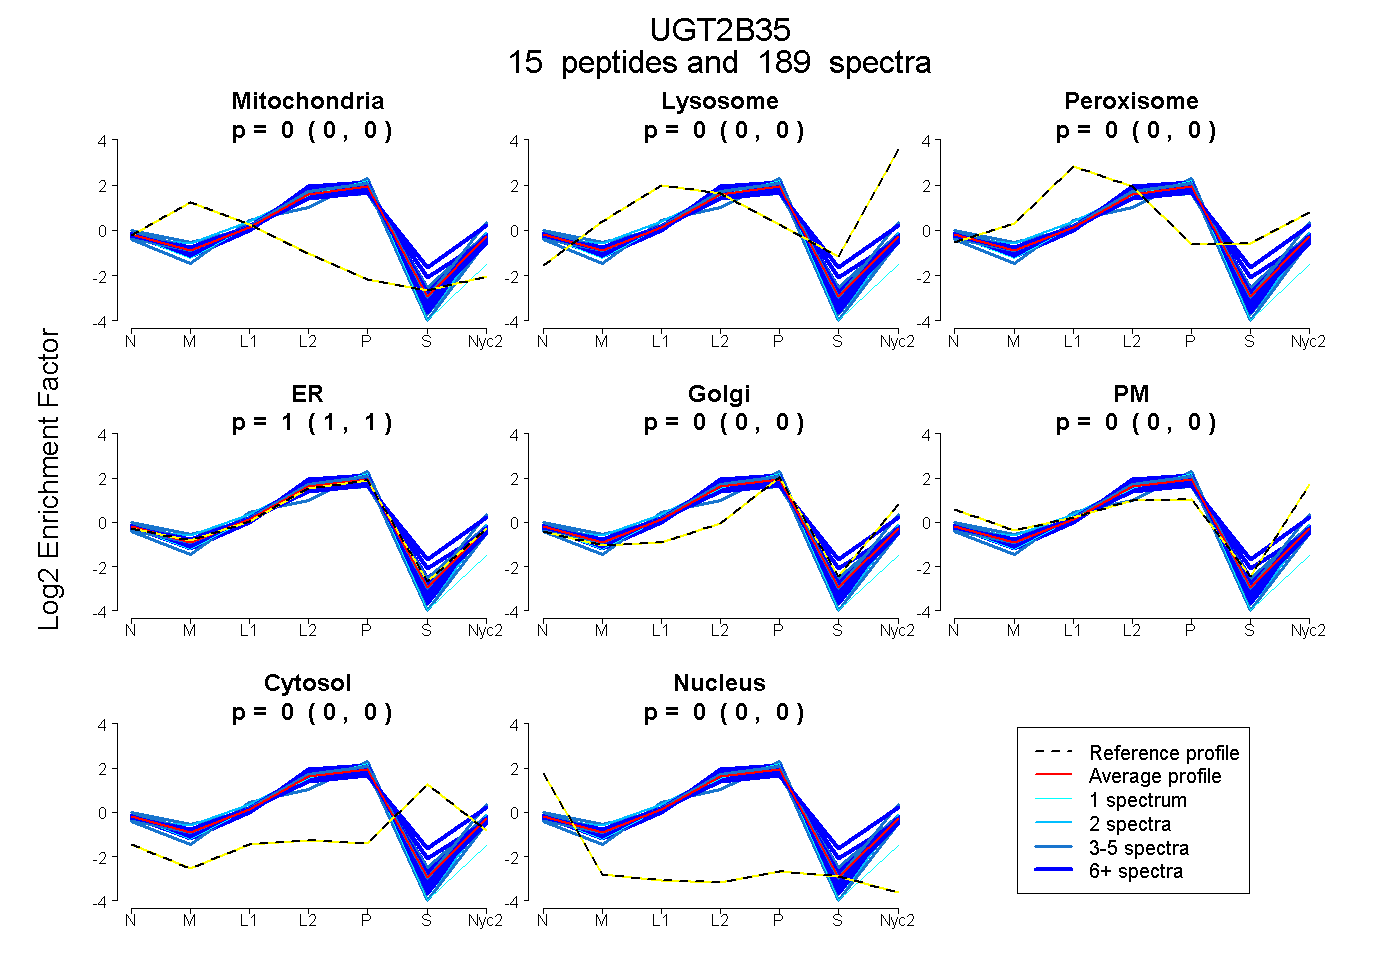
| Expt A |
15 peptides |
189 spectra |
|
0.000 0.000 | 0.000 |
0.000 0.000 | 0.000 |
0.000 0.000 | 0.000 |
1.000 1.000 | 1.000 |
0.000 0.000 | 0.000 |
0.000 0.000 | 0.000 |
0.000 0.000 | 0.000 |
0.000 0.000 | 0.000 |
| 12 spectra, WDPFYSK | 0.000 | 0.081 | 0.027 | 0.716 | 0.000 | 0.080 | 0.096 | 0.000 | ||
| 13 spectra, ETSDLK | 0.000 | 0.000 | 0.000 | 0.997 | 0.000 | 0.003 | 0.000 | 0.000 | ||
| 5 spectra, FSPGYTIEK | 0.040 | 0.000 | 0.016 | 0.819 | 0.000 | 0.125 | 0.000 | 0.000 | ||
| 5 spectra, VLVWPMEYSHWMNLK | 0.000 | 0.043 | 0.000 | 0.886 | 0.000 | 0.071 | 0.000 | 0.000 | ||
| 1 spectrum, SDMLNALEEVINNPFYK | 0.000 | 0.000 | 0.000 | 0.948 | 0.000 | 0.000 | 0.000 | 0.052 | ||
| 10 spectra, EAVSNK | 0.000 | 0.000 | 0.017 | 0.966 | 0.000 | 0.000 | 0.001 | 0.016 | ||
| 14 spectra, FVNVWTYELPR | 0.000 | 0.000 | 0.000 | 1.000 | 0.000 | 0.000 | 0.000 | 0.000 | ||
| 40 spectra, KPPTLGPNTR | 0.000 | 0.000 | 0.000 | 0.994 | 0.000 | 0.000 | 0.000 | 0.006 | ||
| 23 spectra, GAAVEVNFR | 0.000 | 0.000 | 0.003 | 0.979 | 0.000 | 0.018 | 0.000 | 0.000 | ||
| 23 spectra, IILEELVQK | 0.000 | 0.000 | 0.030 | 0.908 | 0.000 | 0.000 | 0.062 | 0.000 | ||
| 3 spectra, GHEVTVLRPSASVFLDPK | 0.000 | 0.000 | 0.000 | 0.987 | 0.000 | 0.000 | 0.000 | 0.013 | ||
| 21 spectra, TLGRPTTLAEIMGK | 0.000 | 0.000 | 0.000 | 1.000 | 0.000 | 0.000 | 0.000 | 0.000 | ||
| 2 spectra, FVTFPTSFSSHDLENFFTR | 0.000 | 0.000 | 0.000 | 0.998 | 0.000 | 0.002 | 0.000 | 0.000 | ||
| 14 spectra, AVFWIEFVMR | 0.000 | 0.000 | 0.000 | 1.000 | 0.000 | 0.000 | 0.000 | 0.000 | ||
| 3 spectra, DIEDFVQSSGEHGVVVFSLGSMVR | 0.000 | 0.000 | 0.000 | 0.908 | 0.087 | 0.000 | 0.000 | 0.006 |
| Plot | Mito | Lyso or Perox | ER | Golgi | PM | Cytosol | Nucleus | ||||||
| Expt B |
15 peptides |
104 spectra |
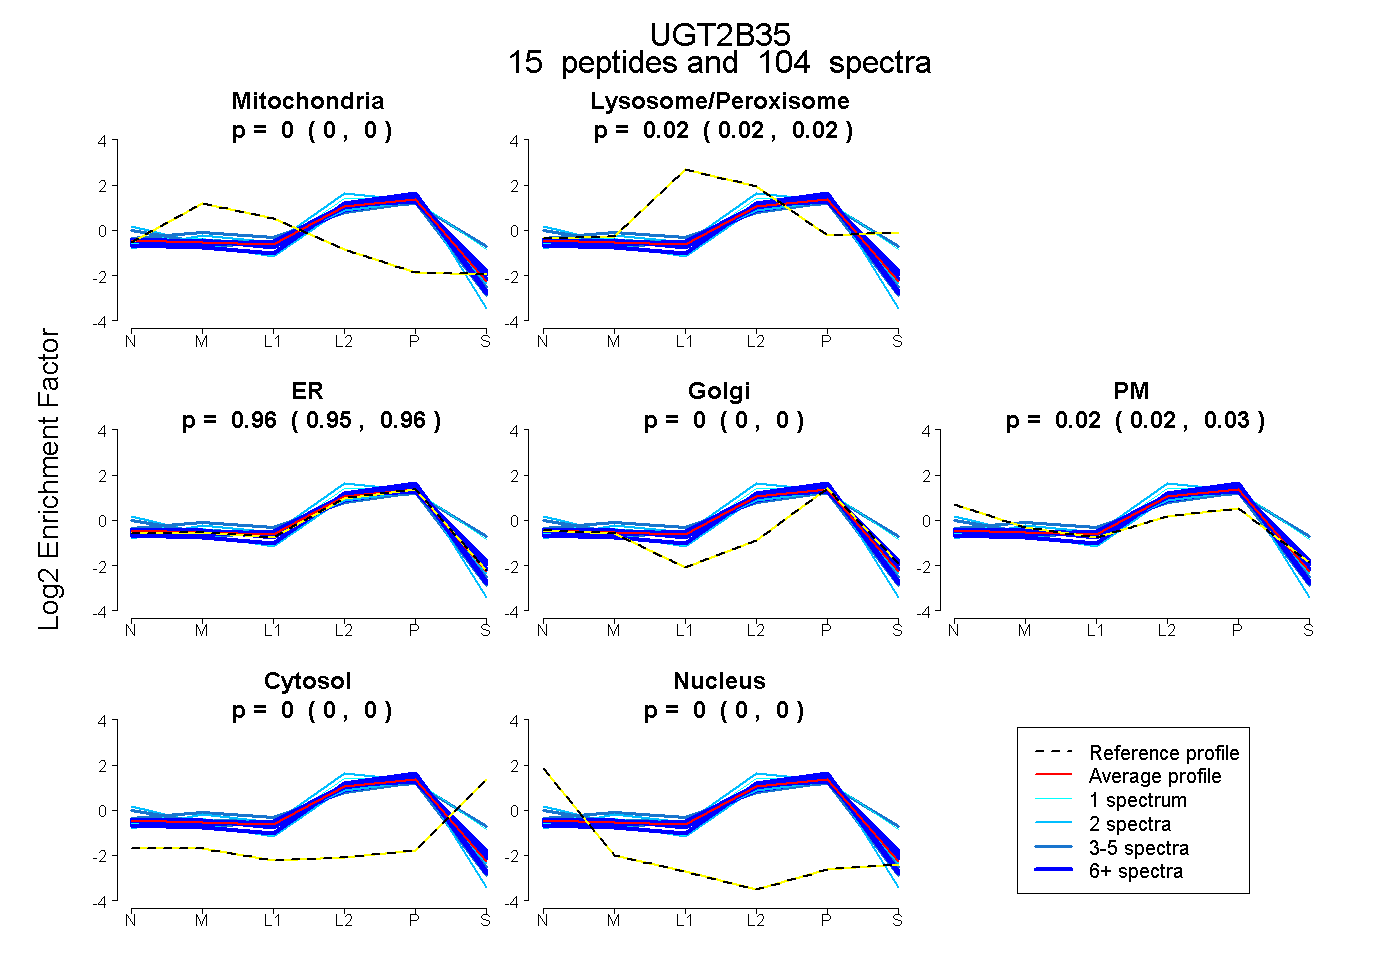 |
0.000 0.000 | 0.000 |
0.019 0.016 | 0.023 |
0.957 0.950 | 0.964 |
0.000 0.000 | 0.000 |
0.023 0.017 | 0.028 |
0.000 0.000 | 0.000 |
0.000 0.000 | 0.000 |
|||
| Plot | Lyso | Other | |||||||||||
| Expt C |
13 peptides |
427 spectra |
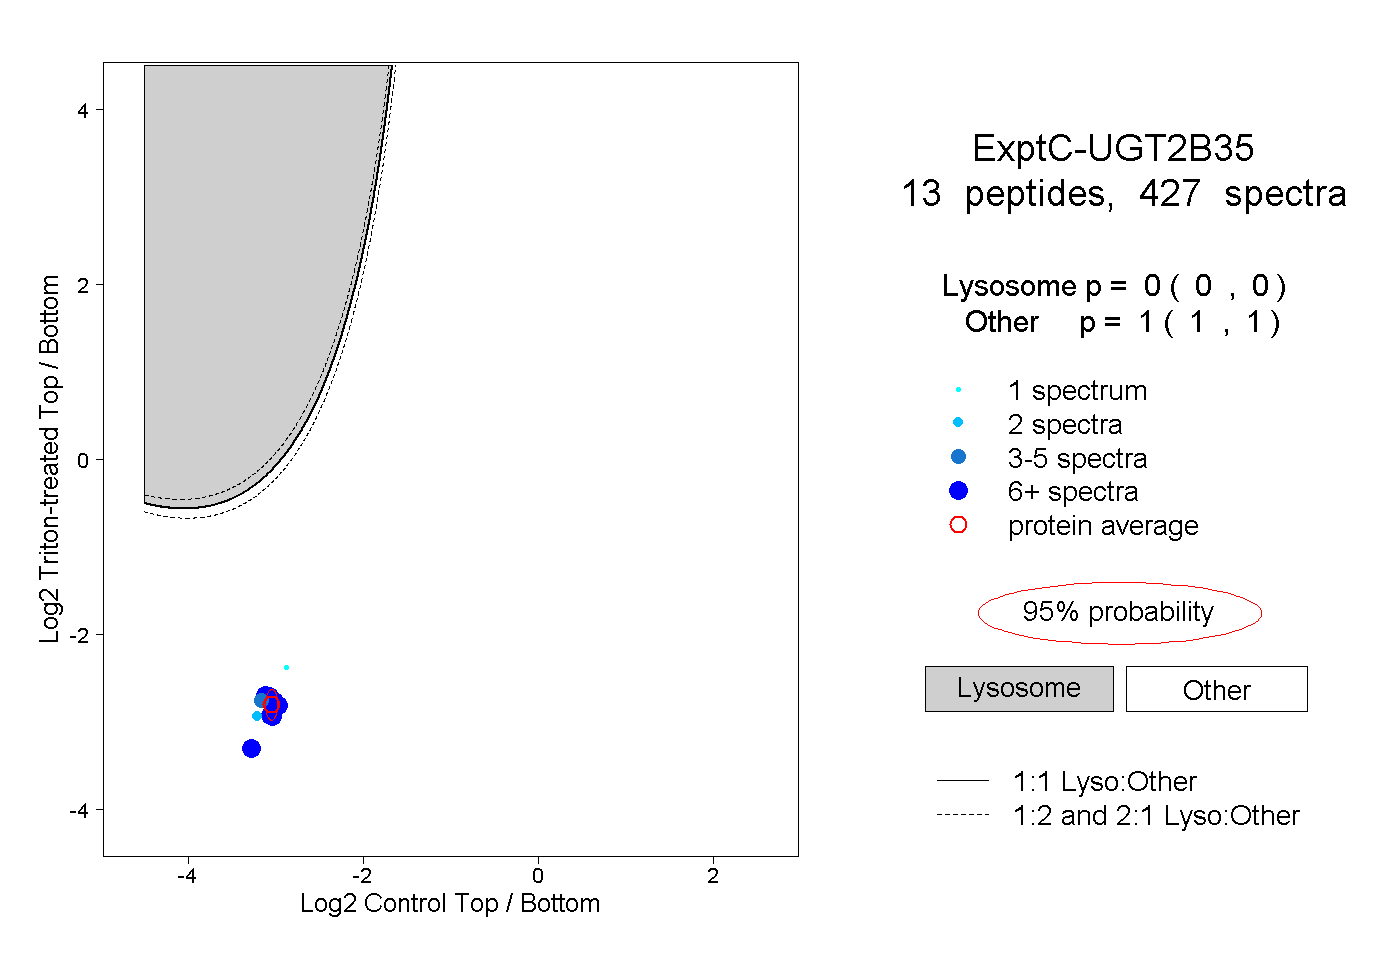 |
0.000 0.000 | 0.000 |
1.000 1.000 | 1.000 |
||||||||
| Plot | Lyso | Other | |||||||||||
| Expt D |
8 peptides |
27 spectra |
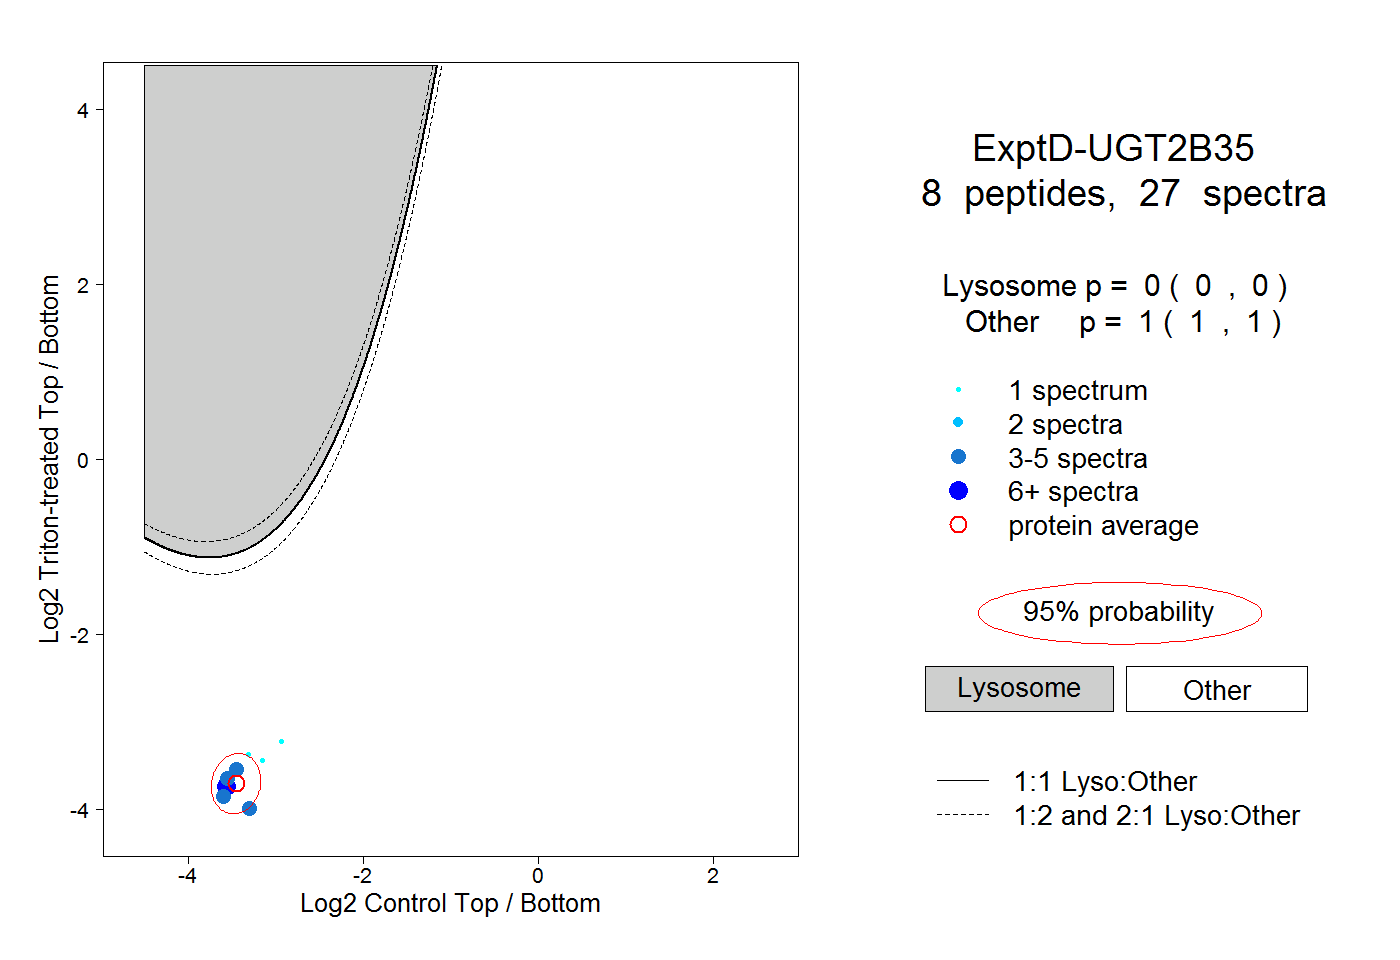 |
0.000 0.000 | 0.000 |
1.000 1.000 | 1.000 |