 11
11peptides
spectra
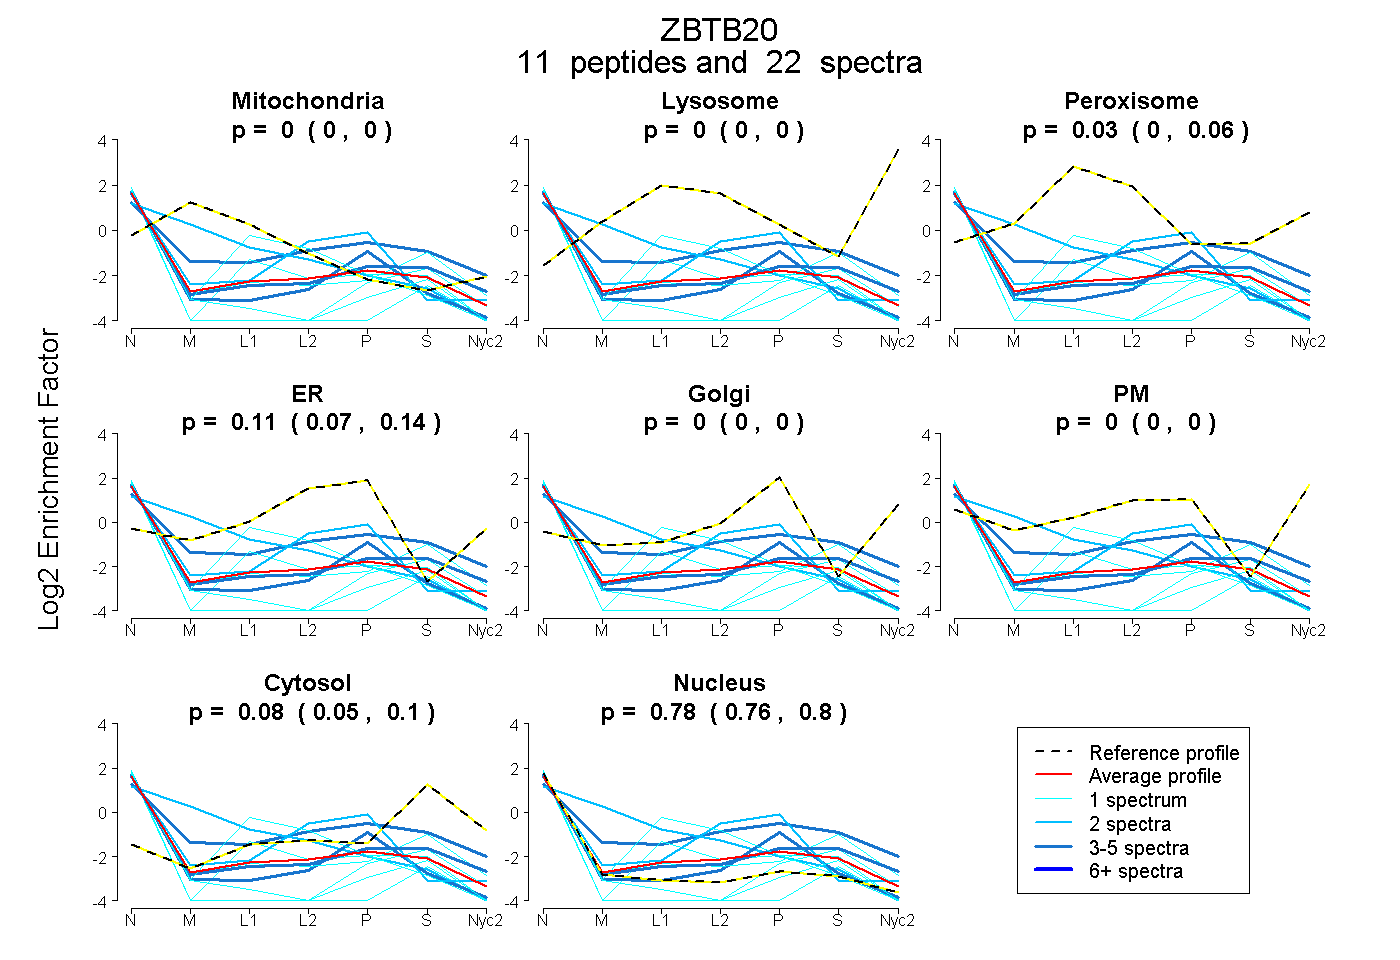
0.000 | 0.000
0.000 | 0.000
0.000 | 0.058
0.071 | 0.137
0.000 | 0.000
0.000 | 0.000
0.055 | 0.100
0.764 | 0.800
2peptides
spectra
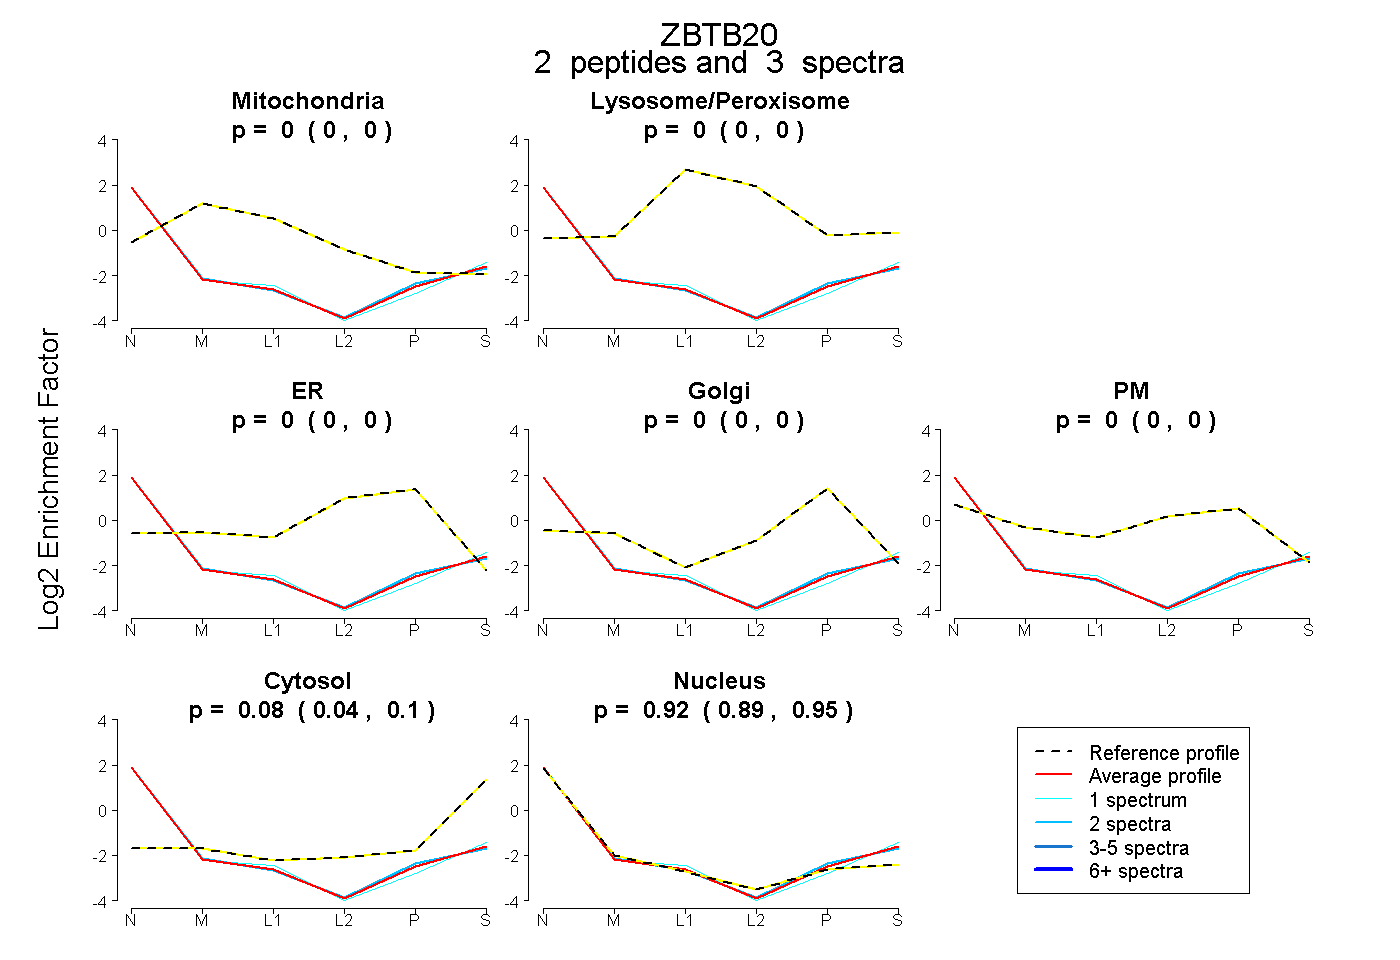
0.000 | 0.000
0.000 | 0.000
0.000 | 0.000
0.000 | 0.000
0.000 | 0.000
0.044 | 0.100
0.894 | 0.950