 11
11peptides
spectra
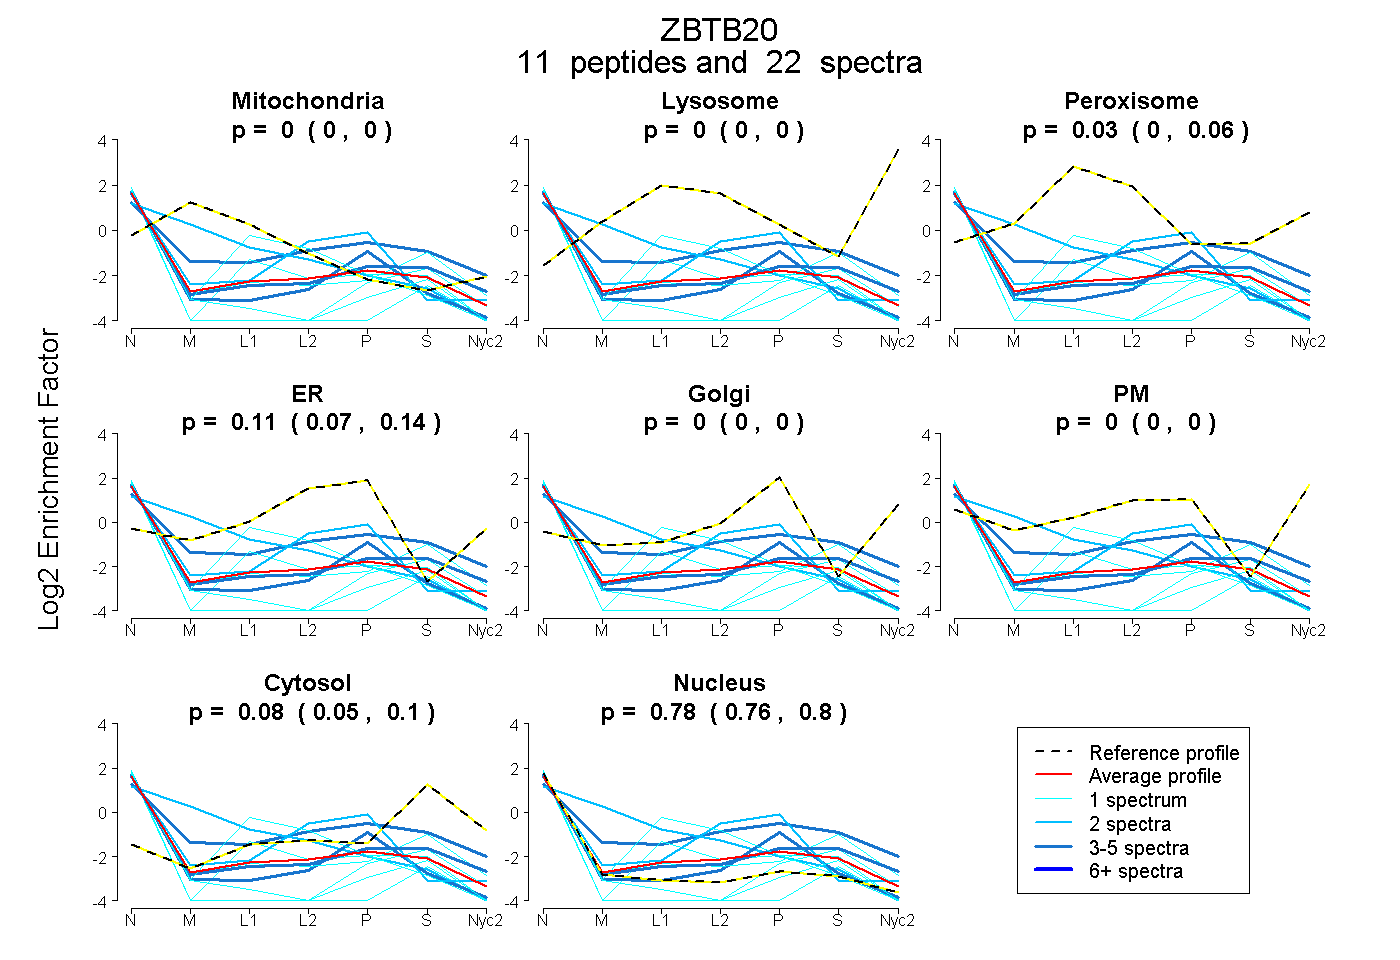
0.000 | 0.000
0.000 | 0.000
0.000 | 0.058
0.071 | 0.137
0.000 | 0.000
0.000 | 0.000
0.055 | 0.100
0.764 | 0.800
| Plot | Mito | Lyso | Perox | ER | Golgi | PM | Cytosol | Nucleus | |||||
| Expt A |
11 peptides |
22 spectra |
|
0.000 0.000 | 0.000 |
0.000 0.000 | 0.000 |
0.026 0.000 | 0.058 |
0.110 0.071 | 0.137 |
0.000 0.000 | 0.000 |
0.000 0.000 | 0.000 |
0.081 0.055 | 0.100 |
0.783 0.764 | 0.800 |
| 1 spectrum, QTETLTSNLR | 0.000 | 0.000 | 0.000 | 0.000 | 0.000 | 0.000 | 0.066 | 0.934 | ||
| 5 spectra, IQTLVGNIHIK | 0.000 | 0.000 | 0.000 | 0.126 | 0.004 | 0.000 | 0.000 | 0.871 | ||
| 1 spectrum, CVLAAGSPFFQDK | 0.000 | 0.000 | 0.000 | 0.000 | 0.000 | 0.000 | 0.000 | 1.000 | ||
| 4 spectra, FDQIEQFNDHMR | 0.000 | 0.000 | 0.115 | 0.246 | 0.000 | 0.016 | 0.201 | 0.422 | ||
| 2 spectra, HMVTHTGVR | 0.642 | 0.000 | 0.000 | 0.000 | 0.000 | 0.000 | 0.000 | 0.358 | ||
| 3 spectra, TVIDECTR | 0.000 | 0.000 | 0.000 | 0.025 | 0.003 | 0.071 | 0.194 | 0.708 | ||
| 1 spectrum, VQILER | 0.000 | 0.000 | 0.229 | 0.051 | 0.000 | 0.000 | 0.000 | 0.720 | ||
| 1 spectrum, GHFCDVTVR | 0.000 | 0.000 | 0.101 | 0.000 | 0.000 | 0.000 | 0.062 | 0.836 | ||
| 1 spectrum, SYECYICK | 0.000 | 0.000 | 0.000 | 0.000 | 0.000 | 0.000 | 0.000 | 1.000 | ||
| 2 spectra, LIDFMYSGVLR | 0.000 | 0.000 | 0.000 | 0.415 | 0.000 | 0.000 | 0.000 | 0.585 | ||
| 1 spectrum, SQQMER | 0.000 | 0.000 | 0.018 | 0.000 | 0.000 | 0.000 | 0.299 | 0.682 |
| Plot | Mito | Lyso or Perox | ER | Golgi | PM | Cytosol | Nucleus | ||||||
| Expt B |
2 peptides |
3 spectra |
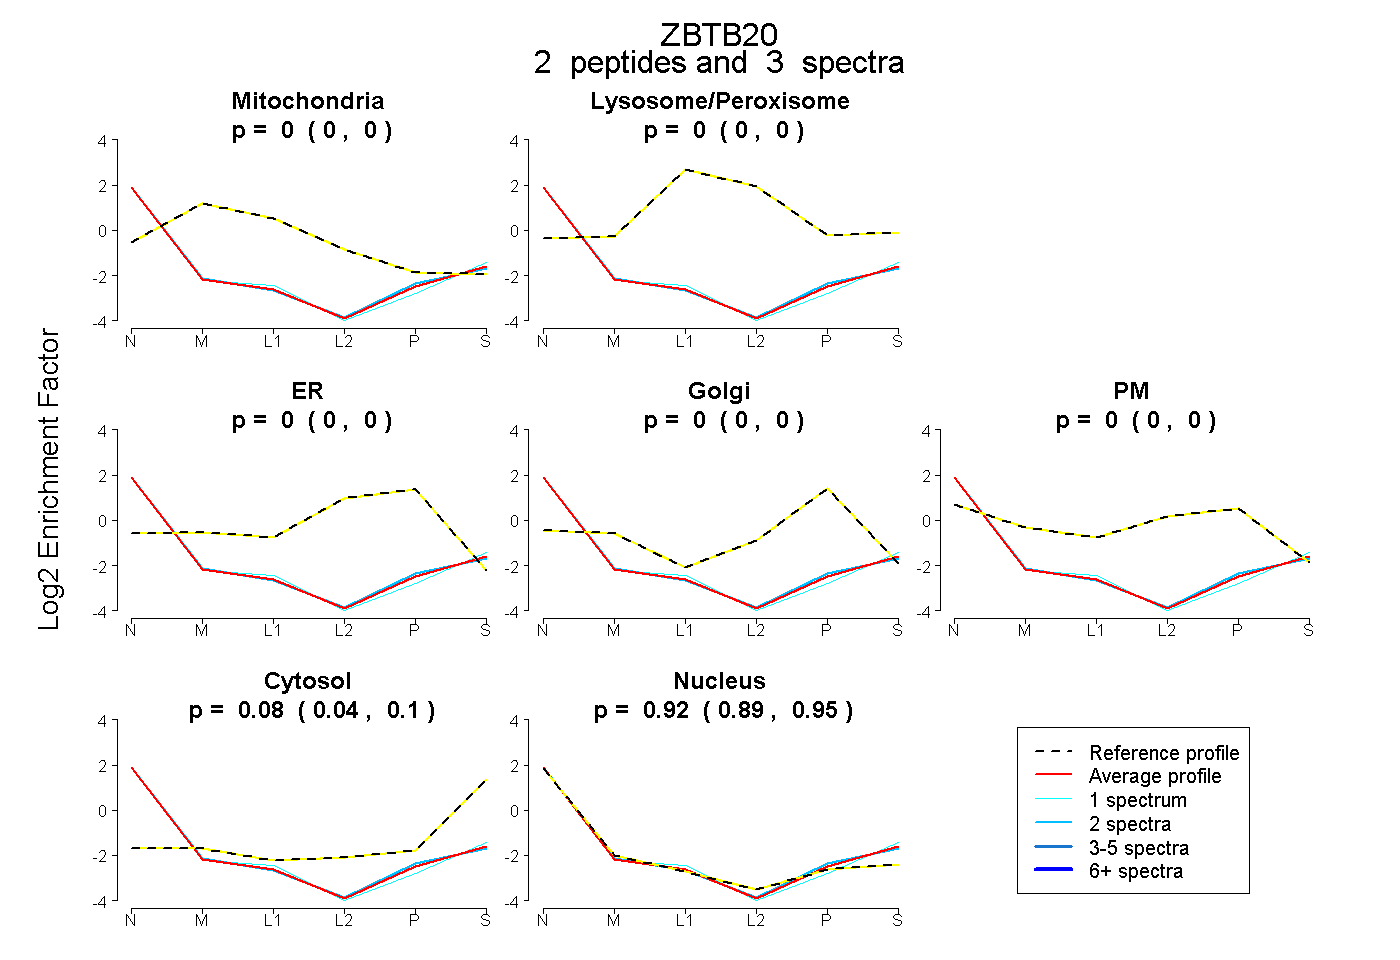 |
0.000 0.000 | 0.000 |
0.000 0.000 | 0.000 |
0.000 0.000 | 0.000 |
0.000 0.000 | 0.000 |
0.000 0.000 | 0.000 |
0.076 0.044 | 0.100 |
0.924 0.894 | 0.950 |