 6
6peptides
spectra
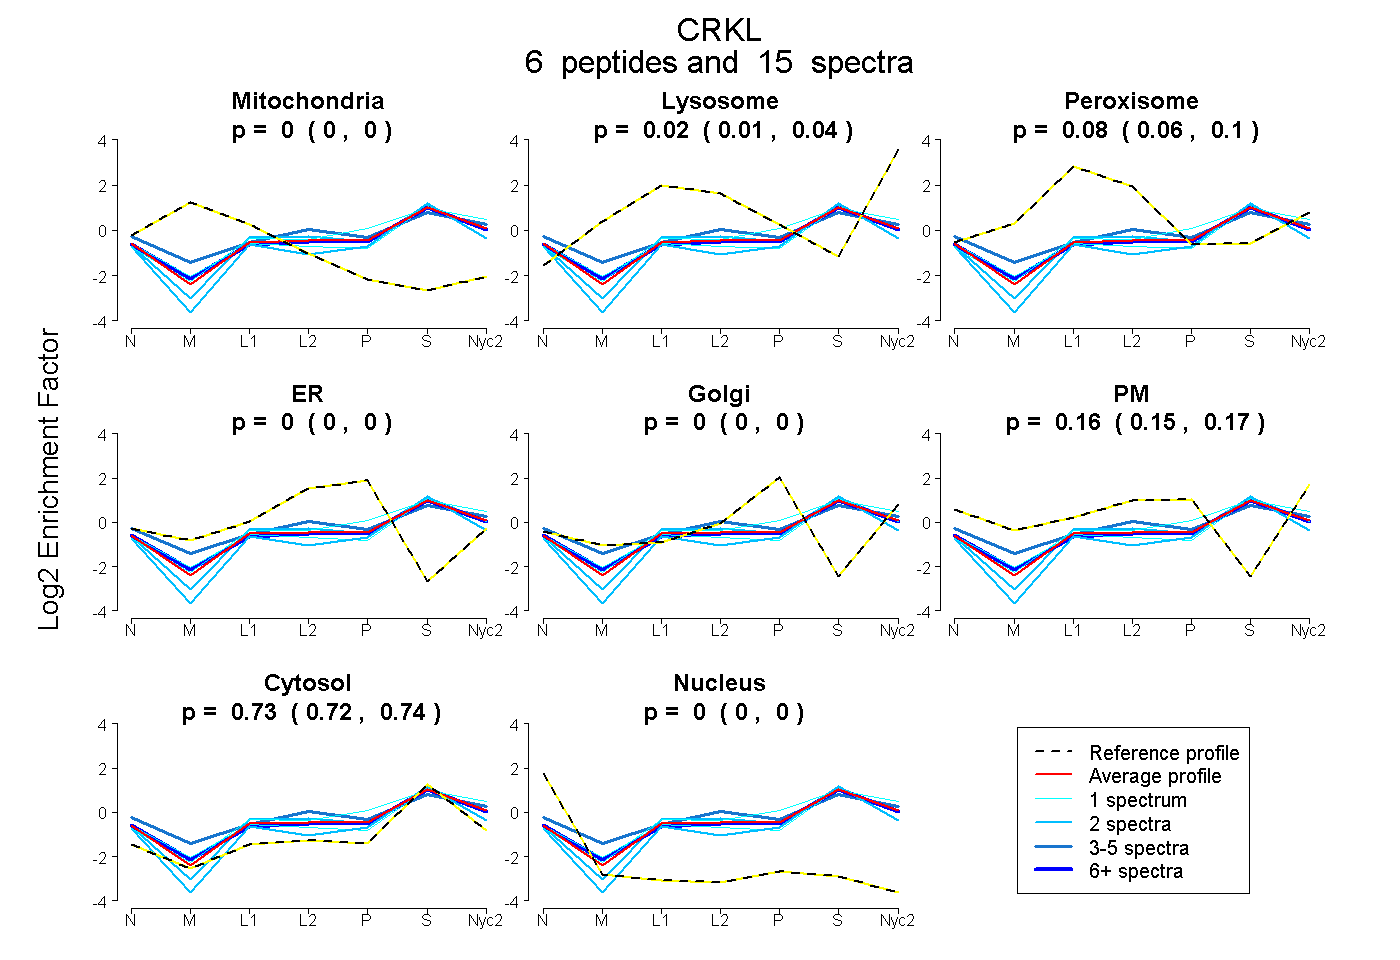
0.000 | 0.000
0.006 | 0.040
0.058 | 0.096
0.000 | 0.000
0.000 | 0.000
0.151 | 0.174
0.719 | 0.743
0.000 | 0.000
1peptide
spectrum
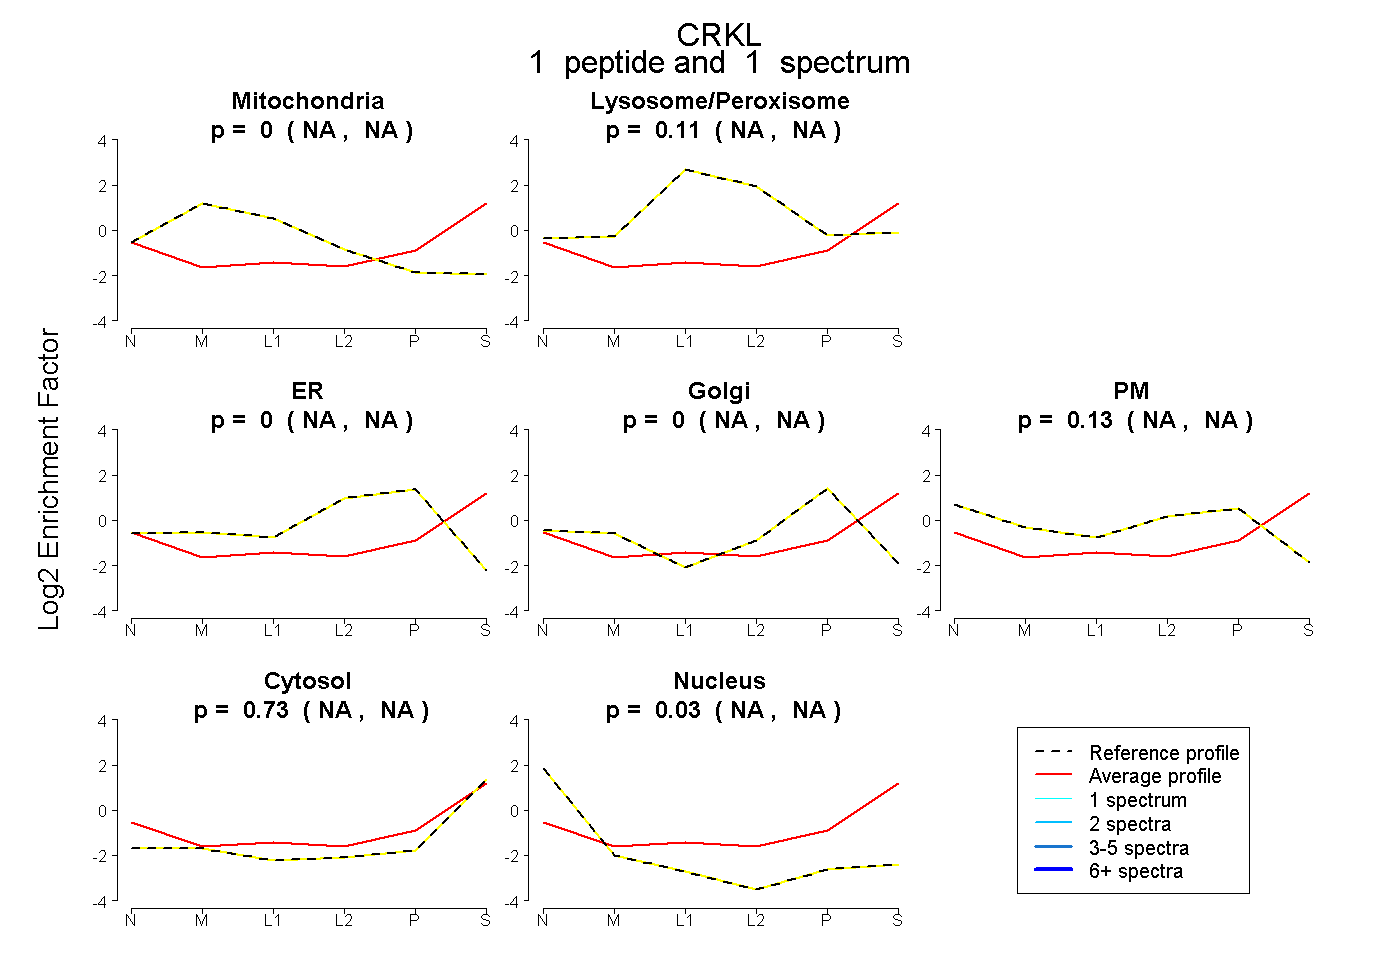
NA | NA
NA | NA
NA | NA
NA | NA
NA | NA
NA | NA
NA | NA
5peptides
spectra
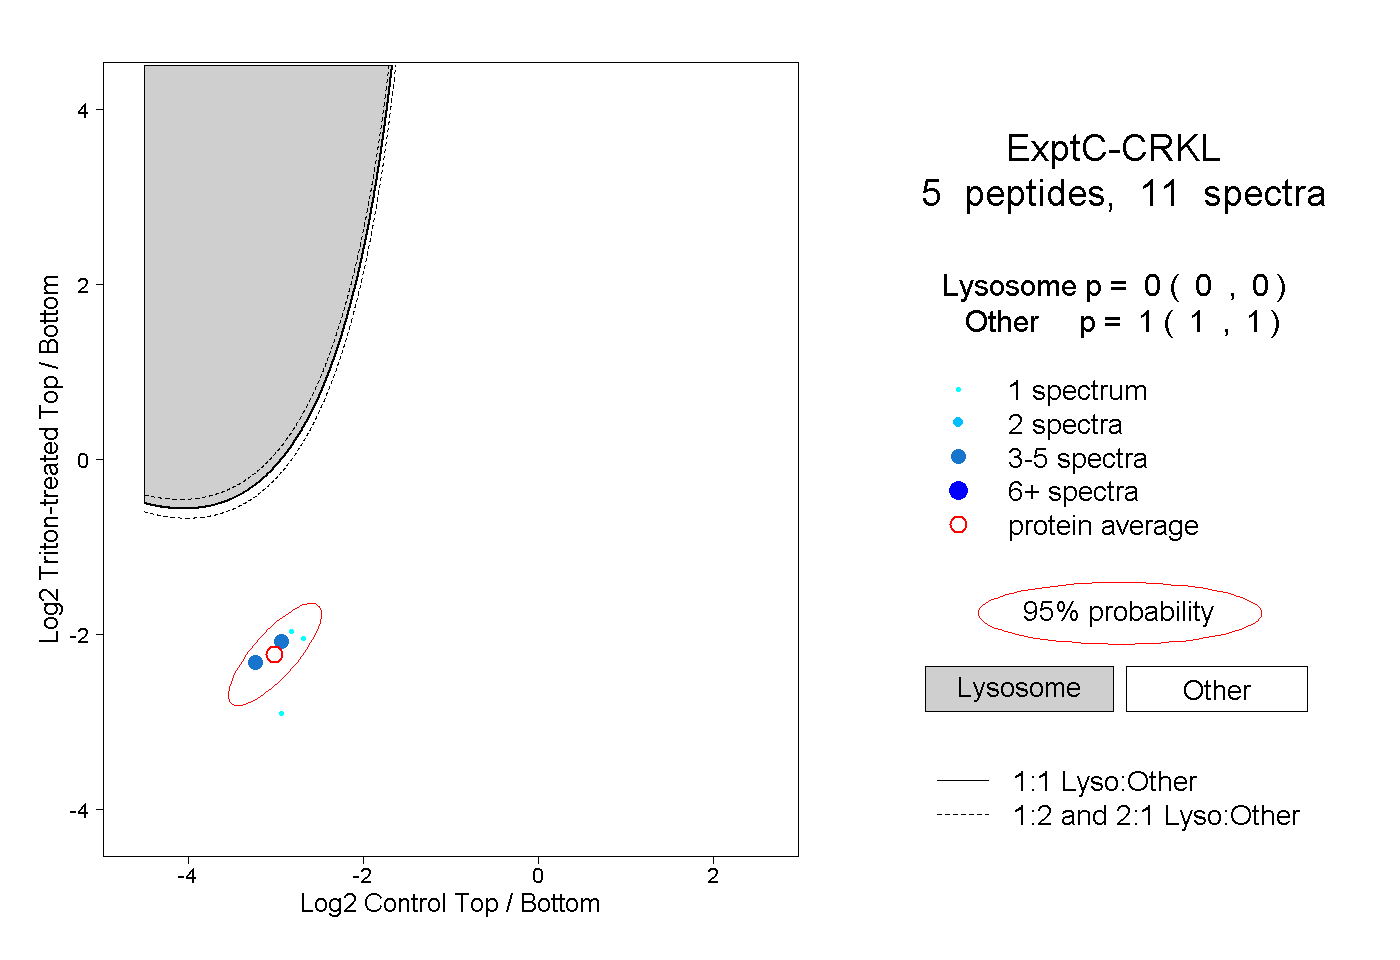
0.000 | 0.000
1.000 | 1.000