 6
6peptides
spectra
0.000 | 0.000
0.006 | 0.040
0.058 | 0.096
0.000 | 0.000
0.000 | 0.000
0.151 | 0.174
0.719 | 0.743
0.000 | 0.000
1peptide
spectrum
NA | NA
NA | NA
NA | NA
NA | NA
NA | NA
NA | NA
NA | NA
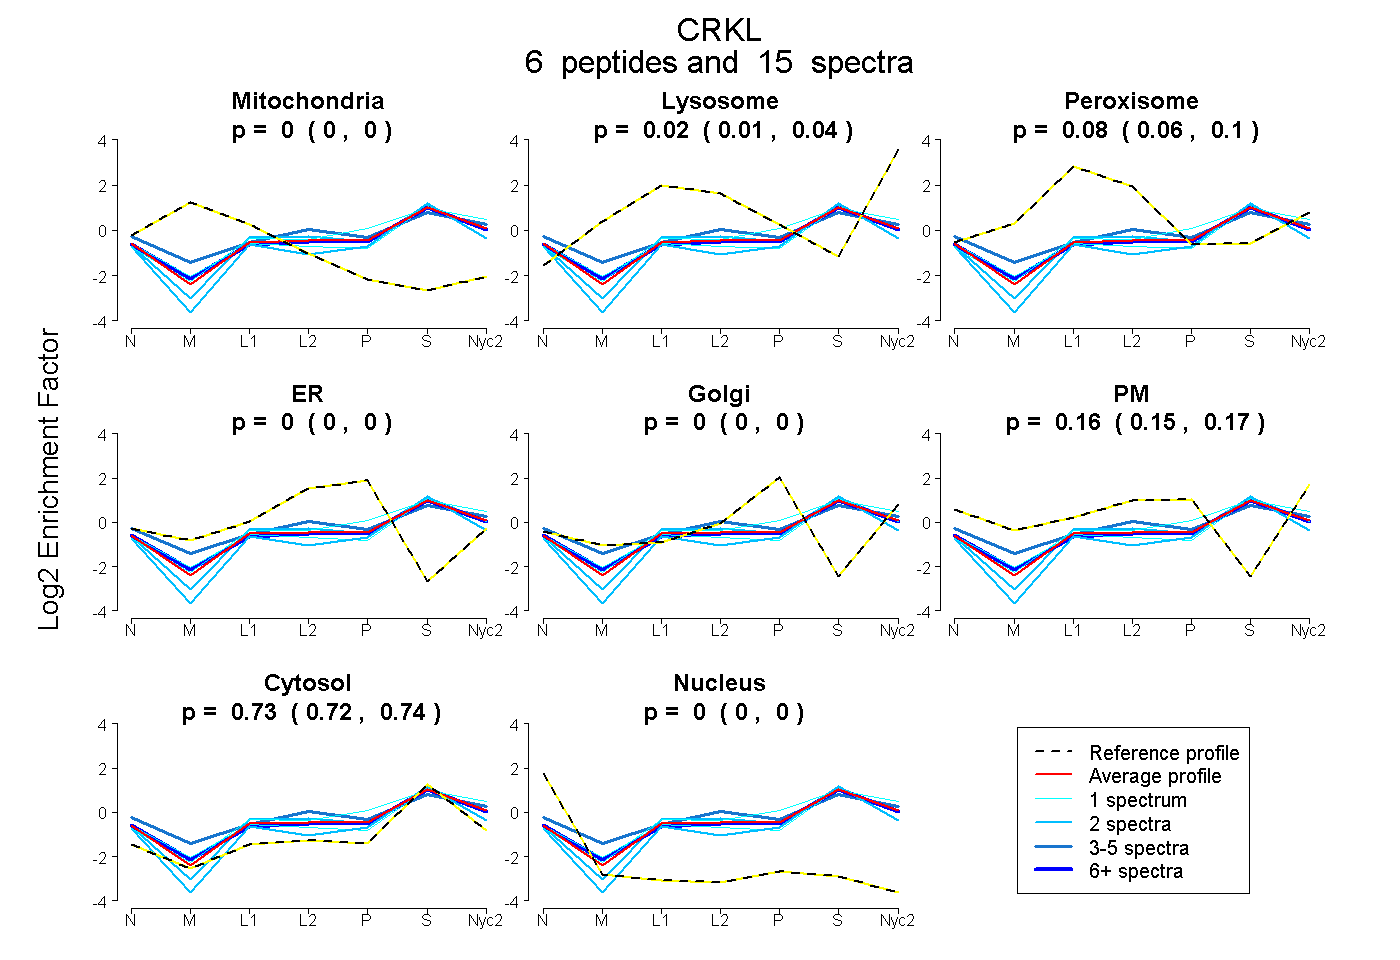
| Plot | Mito | Lyso | Perox | ER | Golgi | PM | Cytosol | Nucleus | |||||
| Expt A |
6 peptides |
15 spectra |
|
0.000 0.000 | 0.000 |
0.024 0.006 | 0.040 |
0.079 0.058 | 0.096 |
0.000 0.000 | 0.000 |
0.000 0.000 | 0.000 |
0.164 0.151 | 0.174 |
0.733 0.719 | 0.743 |
0.000 0.000 | 0.000 |
||
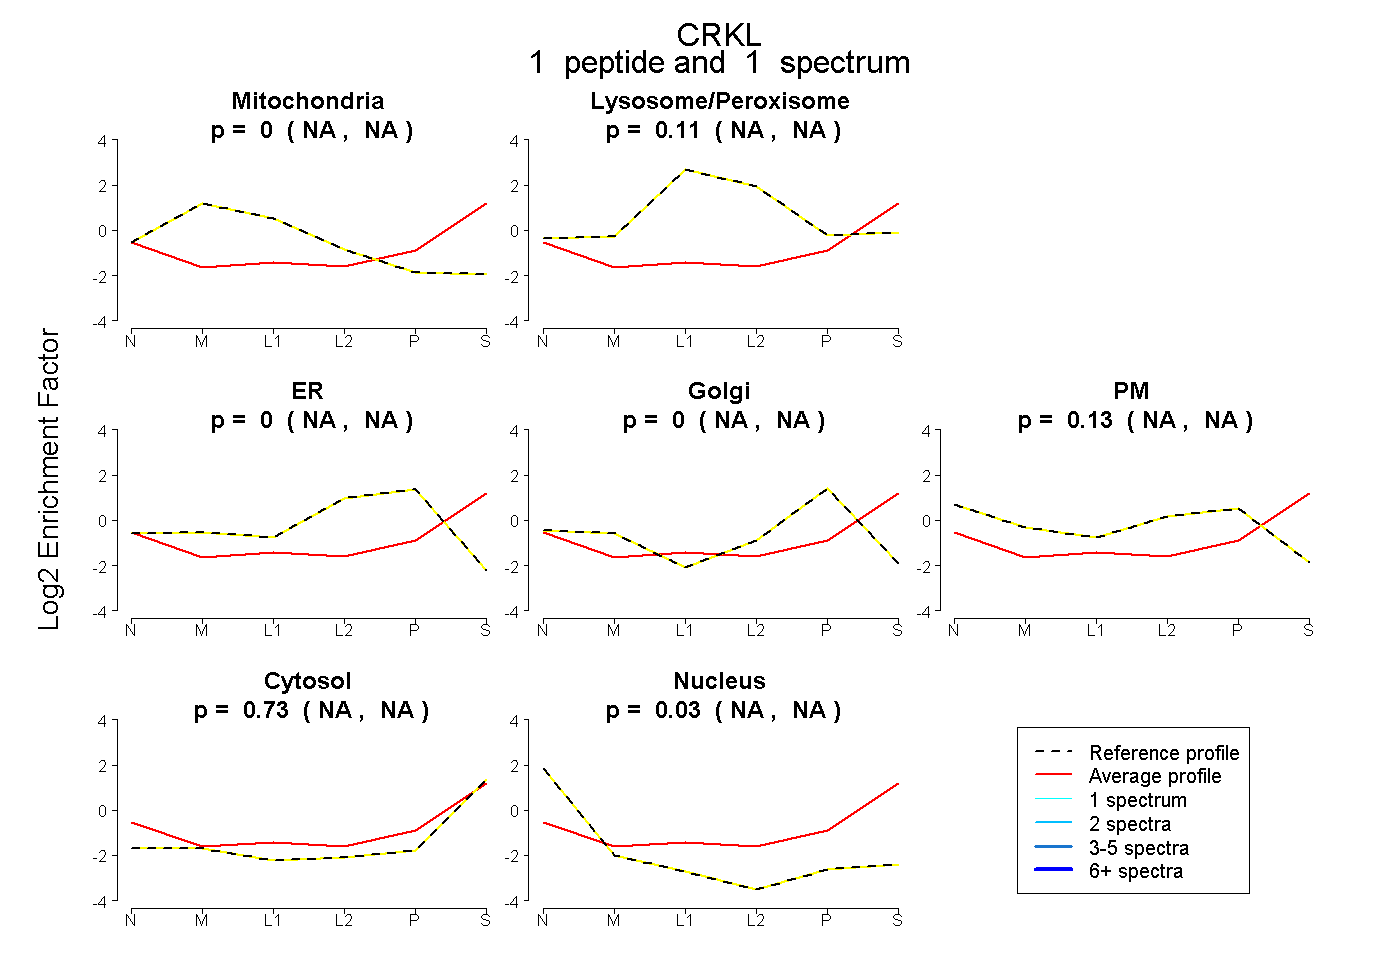
| Plot | Mito | Lyso or Perox | ER | Golgi | PM | Cytosol | Nucleus | ||||||
| Expt B |
1 peptide |
1 spectrum |
|
0.000 NA | NA |
0.110 NA | NA |
0.000 NA | NA |
0.000 NA | NA |
0.128 NA | NA |
0.730 NA | NA |
0.032 NA | NA |
| 1 spectrum, IGDQEFDHLPALLEFYK | 0.000 | 0.110 | 0.000 | 0.000 | 0.128 | 0.730 | 0.032 |
| Plot | Lyso | Other | |||||||||||
| Expt C |
5 peptides |
11 spectra |
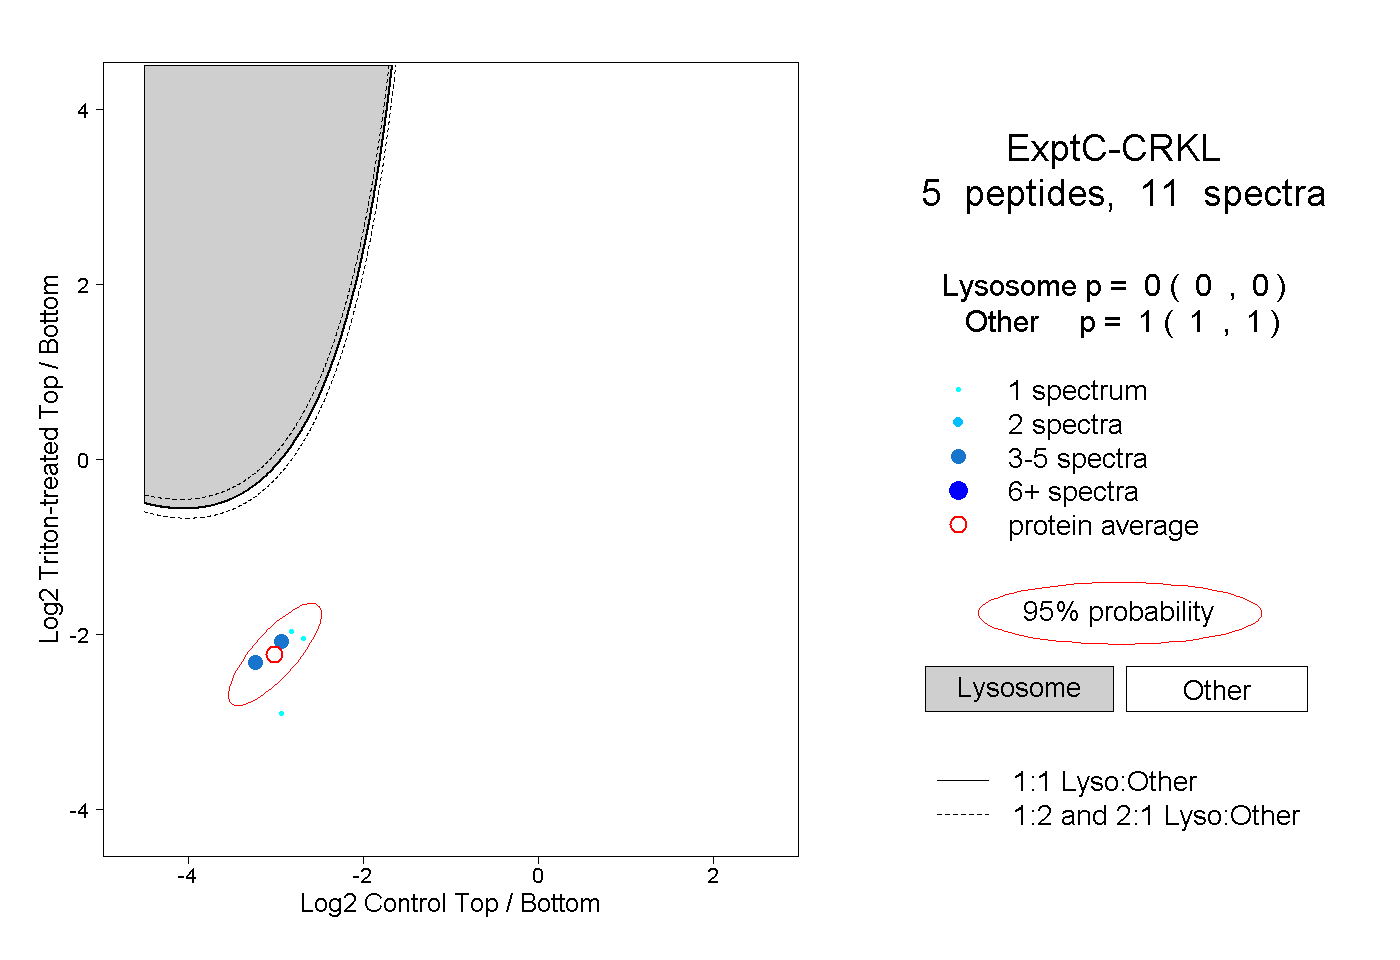 |
0.000 0.000 | 0.000 |
1.000 1.000 | 1.000 |