 6
6peptides
spectra
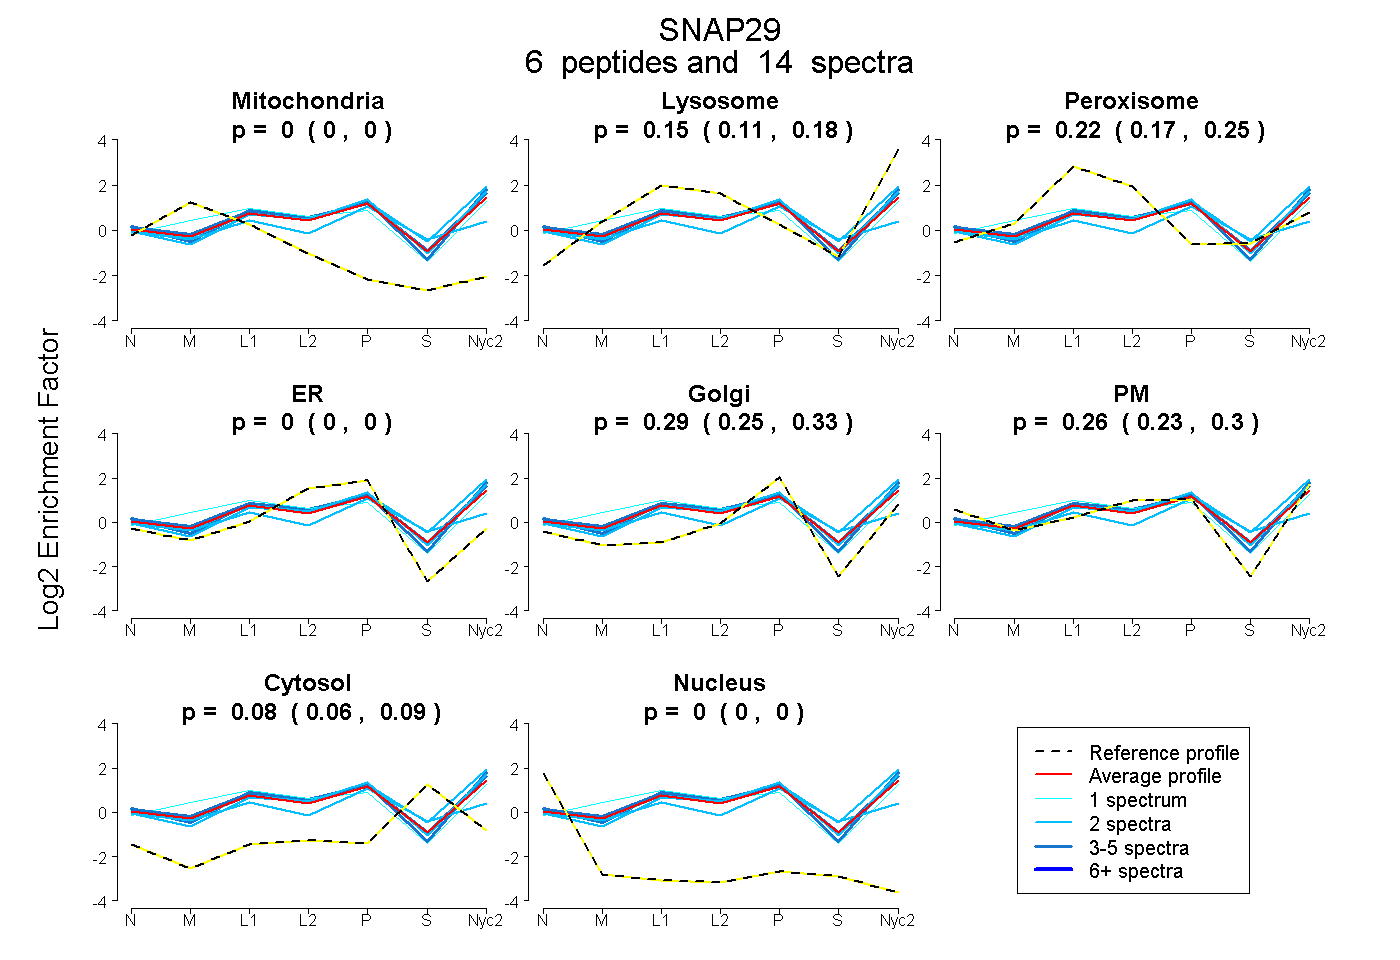
0.000 | 0.000
0.112 | 0.178
0.174 | 0.248
0.000 | 0.000
0.255 | 0.326
0.225 | 0.296
0.064 | 0.089
0.000 | 0.000
3peptides
spectra
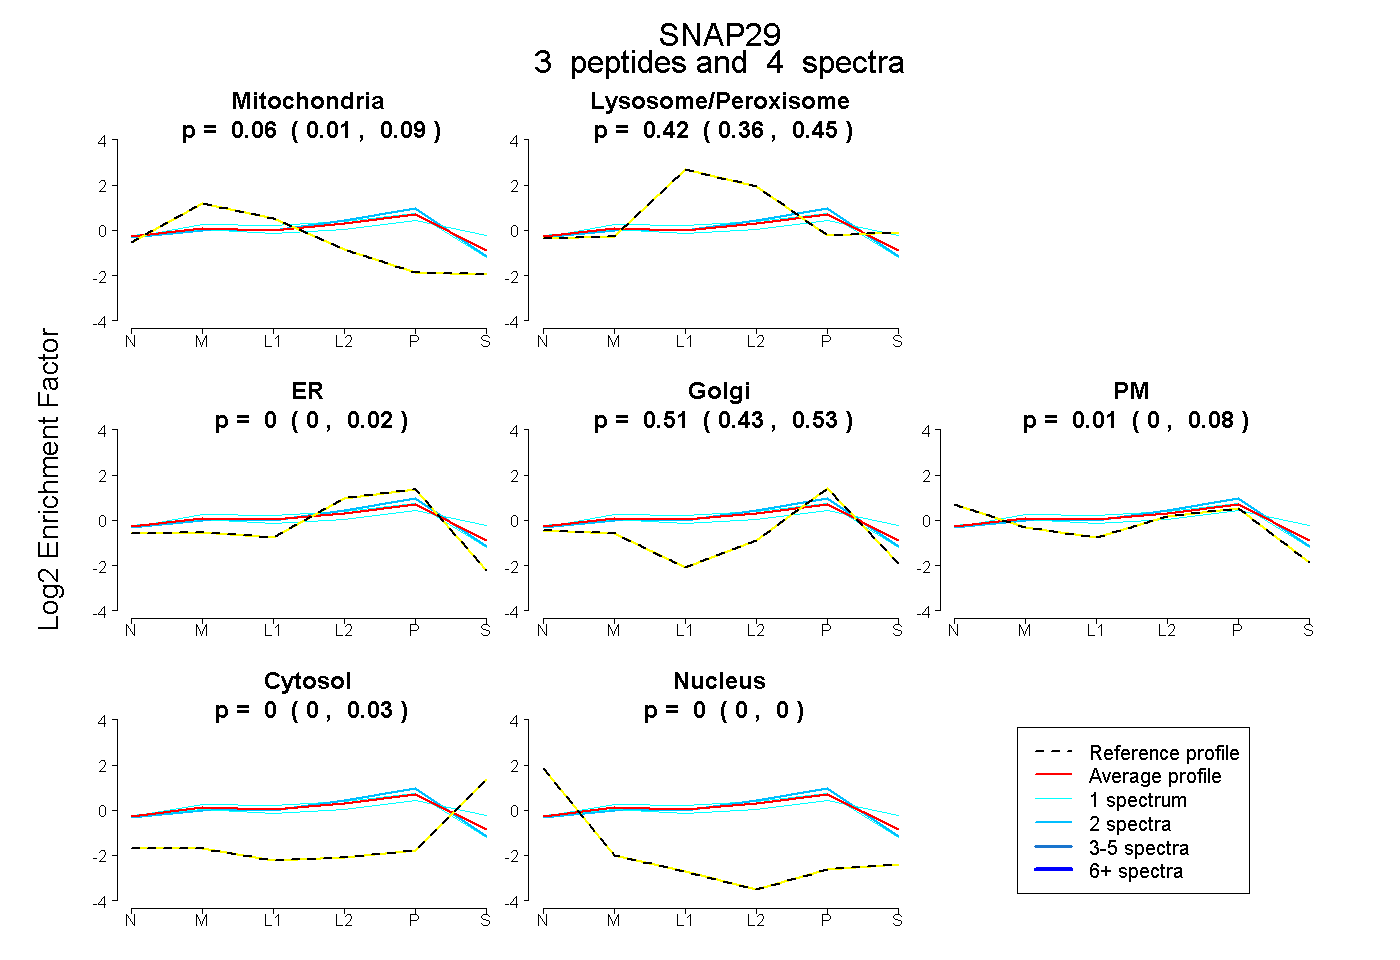
0.014 | 0.095
0.358 | 0.446
0.000 | 0.019
0.430 | 0.534
0.000 | 0.080
0.000 | 0.027
0.000 | 0.000
7peptides
spectra
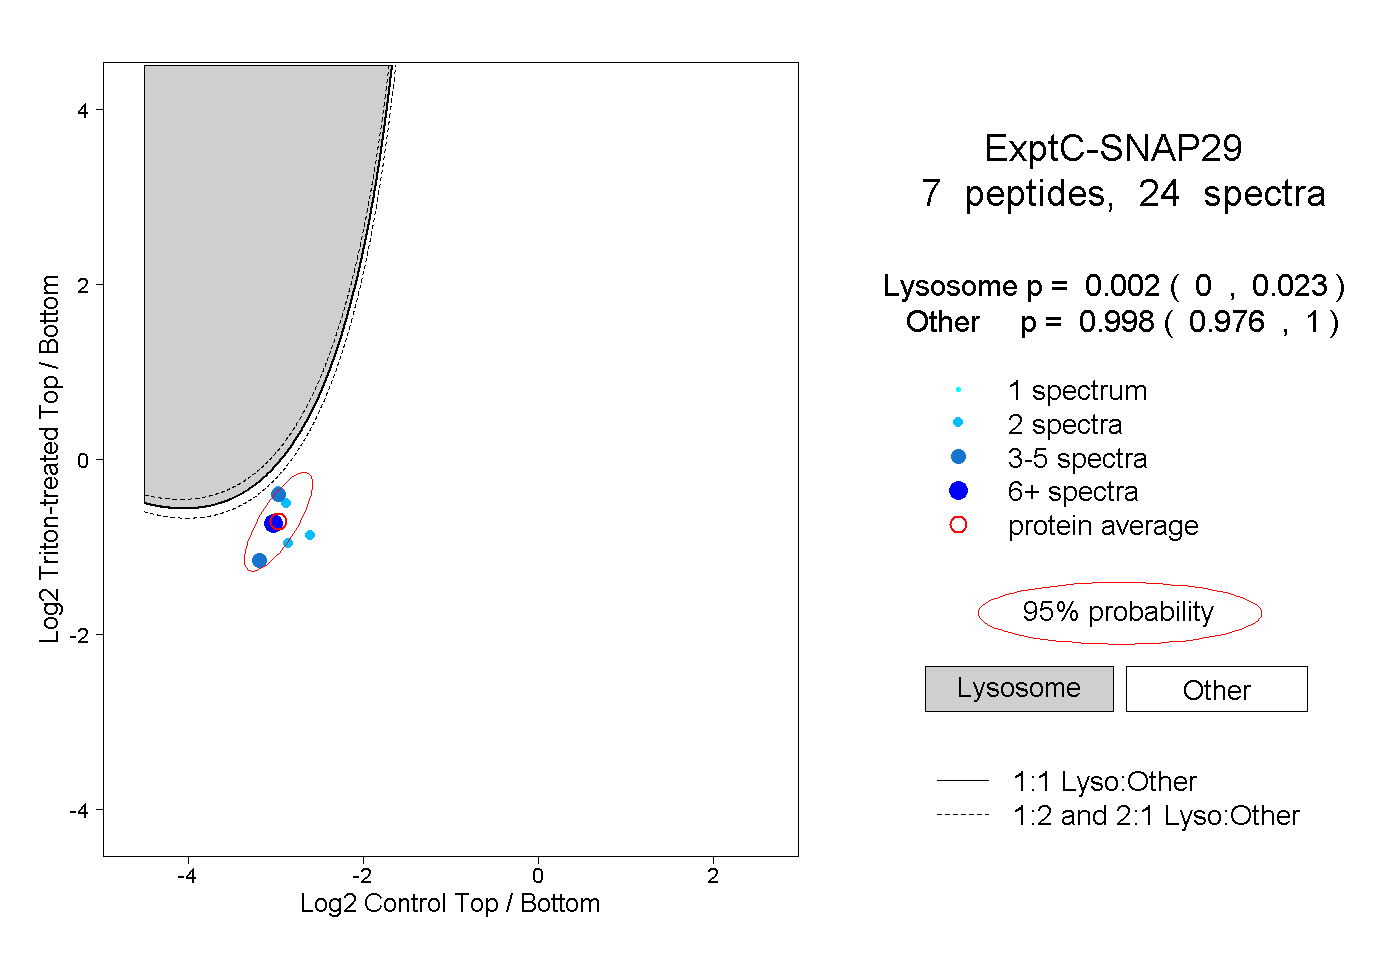
0.000 | 0.023
0.976 | 1.000
3peptides
spectra
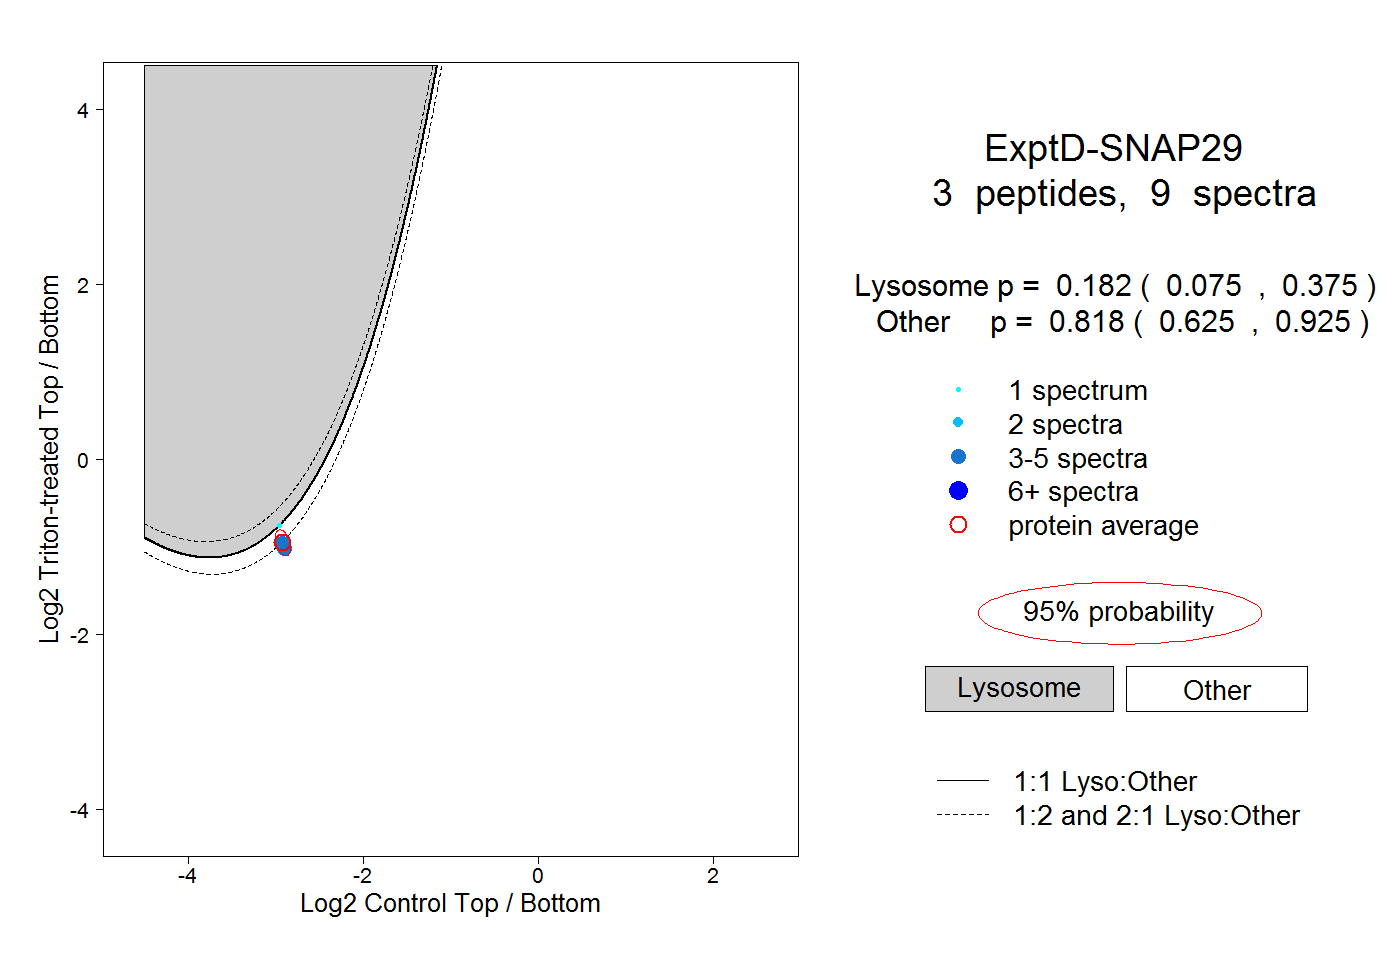
0.075 | 0.375
0.625 | 0.925