 6
6peptides
spectra
0.000 | 0.000
0.112 | 0.178
0.174 | 0.248
0.000 | 0.000
0.255 | 0.326
0.225 | 0.296
0.064 | 0.089
0.000 | 0.000
| Plot | Mito | Lyso | Perox | ER | Golgi | PM | Cytosol | Nucleus | |||||
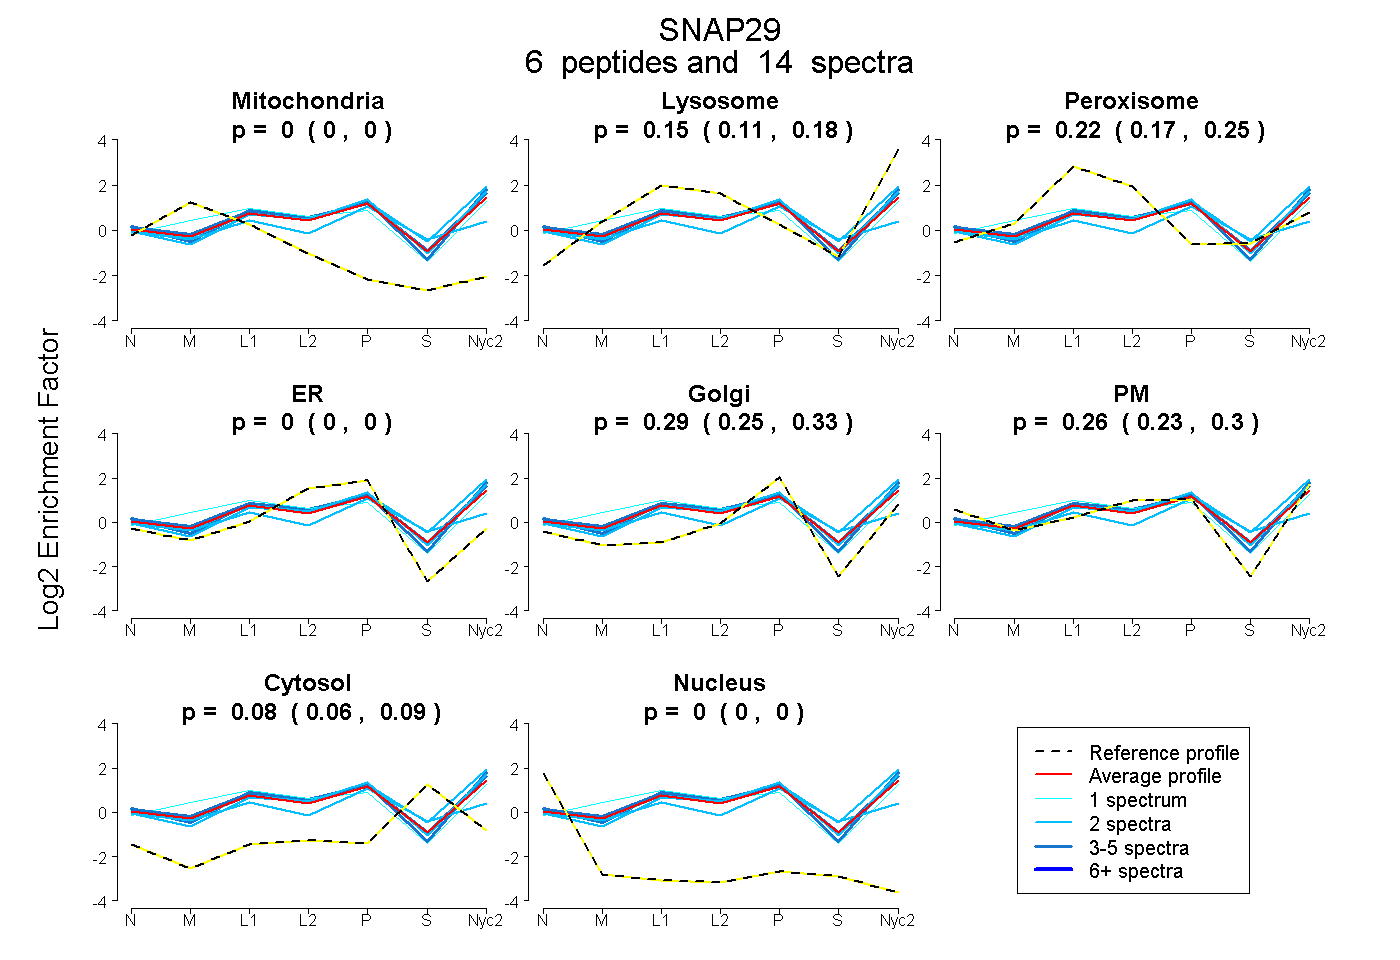
| Expt A |
6 peptides |
14 spectra |
|
0.000 0.000 | 0.000 |
0.148 0.112 | 0.178 |
0.215 0.174 | 0.248 |
0.000 0.000 | 0.000 |
0.294 0.255 | 0.326 |
0.264 0.225 | 0.296 |
0.078 0.064 | 0.089 |
0.000 0.000 | 0.000 |
| 4 spectra, IGVASSEELVR | 0.000 | 0.191 | 0.143 | 0.000 | 0.235 | 0.403 | 0.027 | 0.000 | ||
| 2 spectra, SVFGGFINYFK | 0.000 | 0.219 | 0.146 | 0.000 | 0.312 | 0.272 | 0.052 | 0.000 | ||
| 1 spectrum, HINSIK | 0.076 | 0.170 | 0.260 | 0.000 | 0.258 | 0.237 | 0.000 | 0.000 | ||
| 3 spectra, DLPDGPDAPIDR | 0.000 | 0.152 | 0.183 | 0.000 | 0.182 | 0.397 | 0.086 | 0.000 | ||
| 2 spectra, AEATAASTSR | 0.000 | 0.326 | 0.031 | 0.000 | 0.152 | 0.329 | 0.163 | 0.000 | ||
| 2 spectra, YQASHPNLR | 0.000 | 0.000 | 0.339 | 0.000 | 0.476 | 0.000 | 0.185 | 0.000 |
| Plot | Mito | Lyso or Perox | ER | Golgi | PM | Cytosol | Nucleus | ||||||
| Expt B |
3 peptides |
4 spectra |
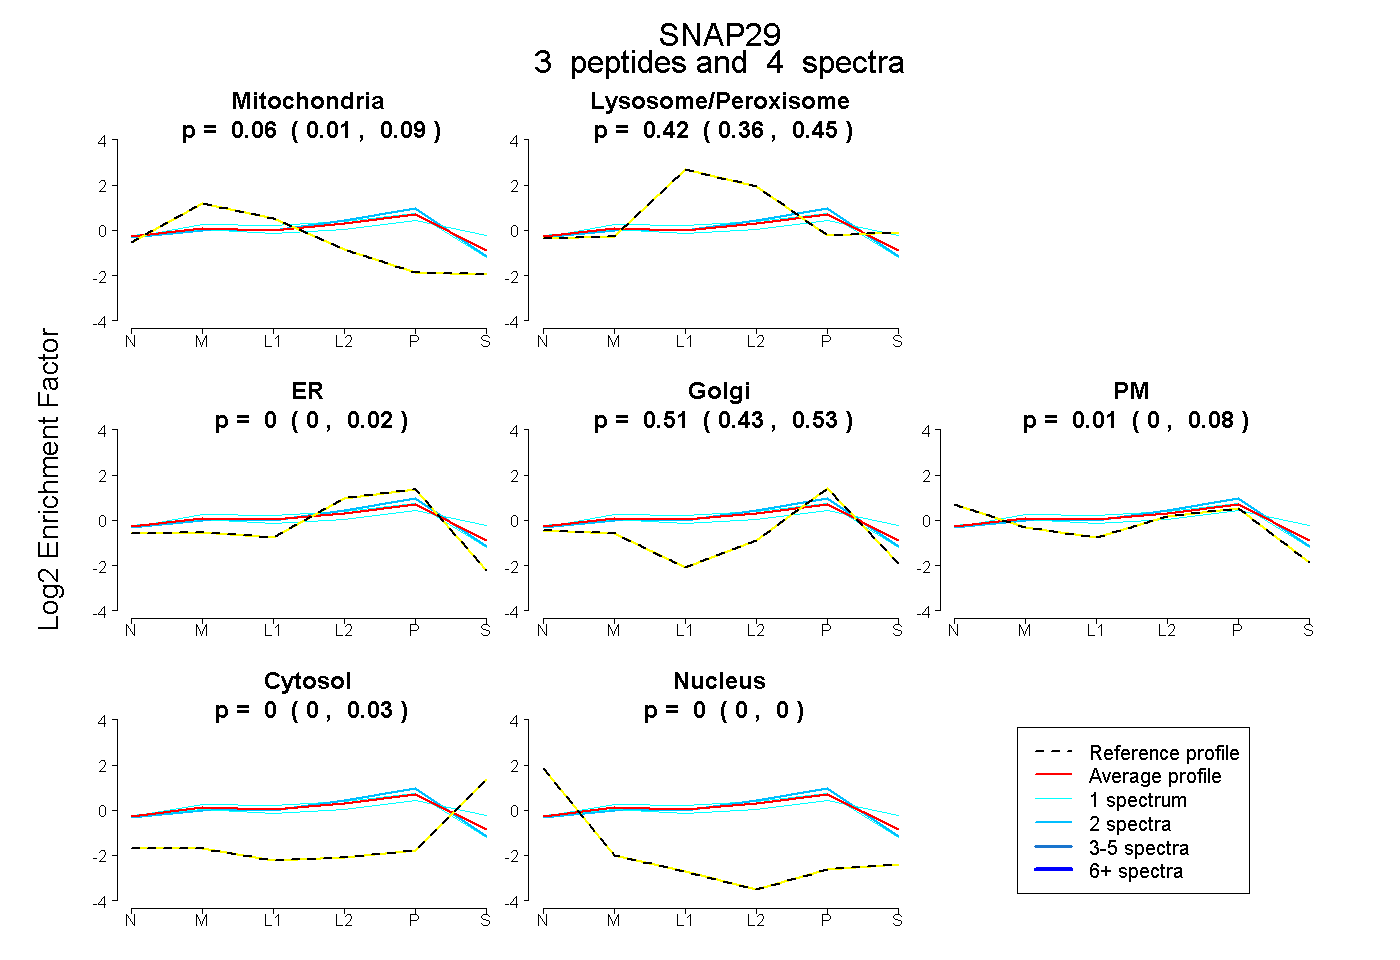 |
0.060 0.014 | 0.095 |
0.416 0.358 | 0.446 |
0.000 0.000 | 0.019 |
0.510 0.430 | 0.534 |
0.013 0.000 | 0.080 |
0.000 0.000 | 0.027 |
0.000 0.000 | 0.000 |
|||
| Plot | Lyso | Other | |||||||||||
| Expt C |
7 peptides |
24 spectra |
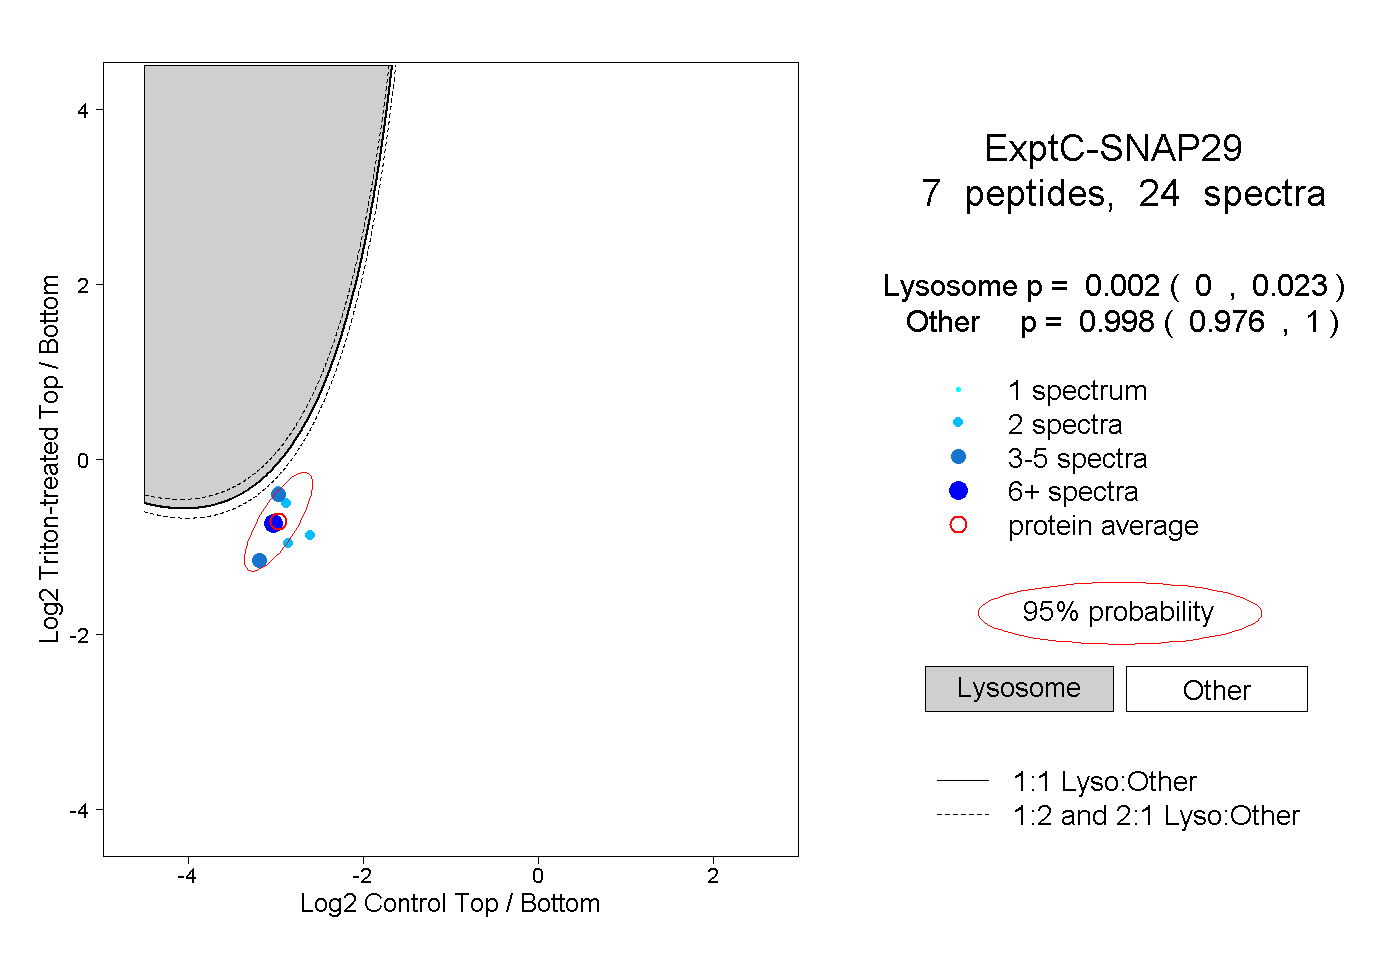 |
0.002 0.000 | 0.023 |
0.998 0.976 | 1.000 |
||||||||
| Plot | Lyso | Other | |||||||||||
| Expt D |
3 peptides |
9 spectra |
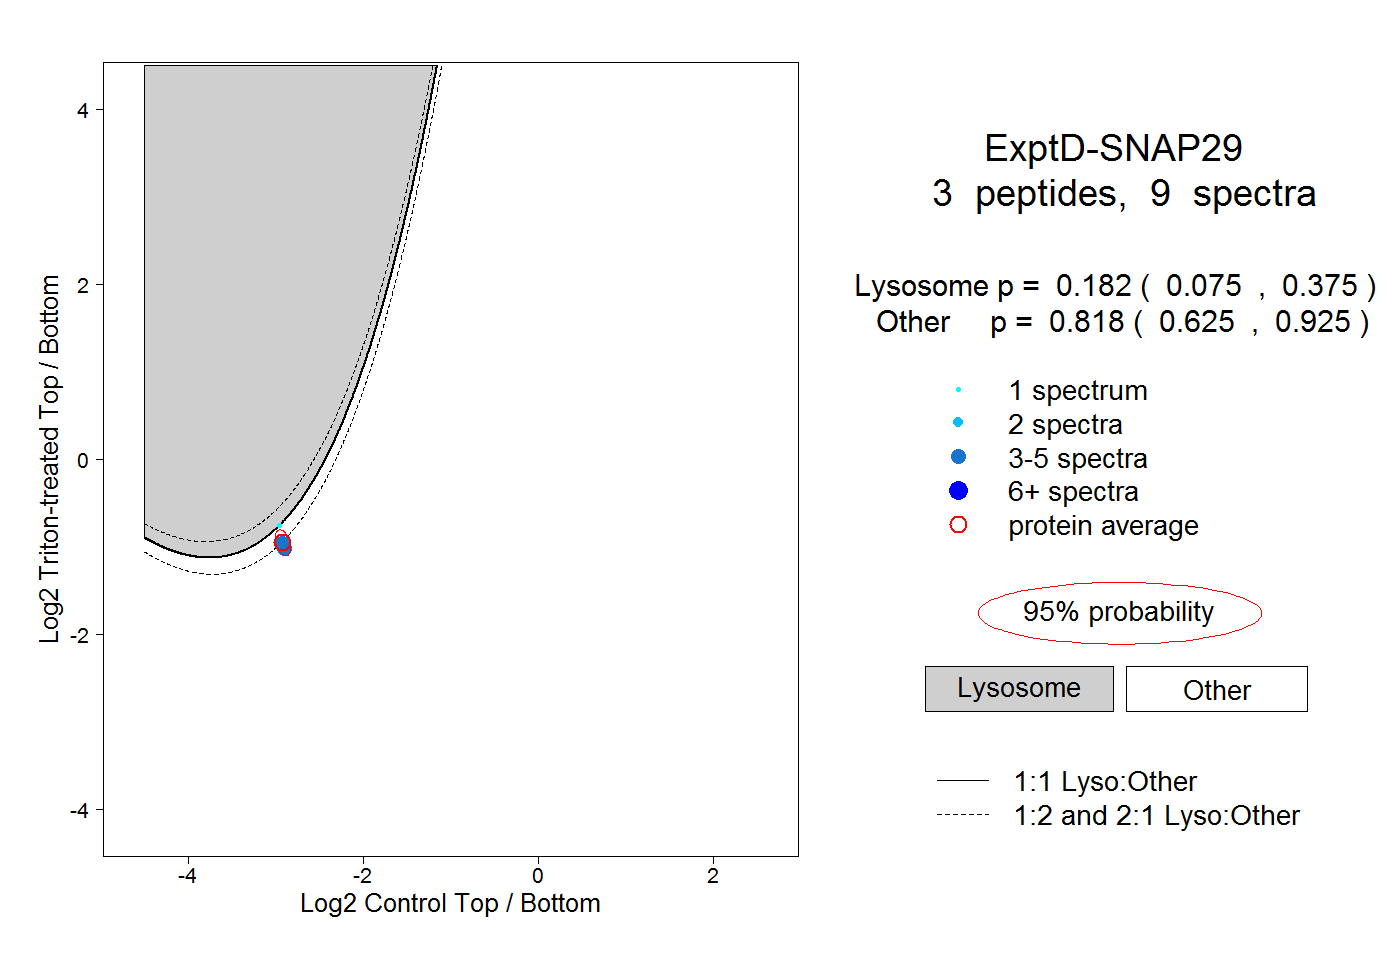 |
0.182 0.075 | 0.375 |
0.818 0.625 | 0.925 |