 10
10peptides
spectra
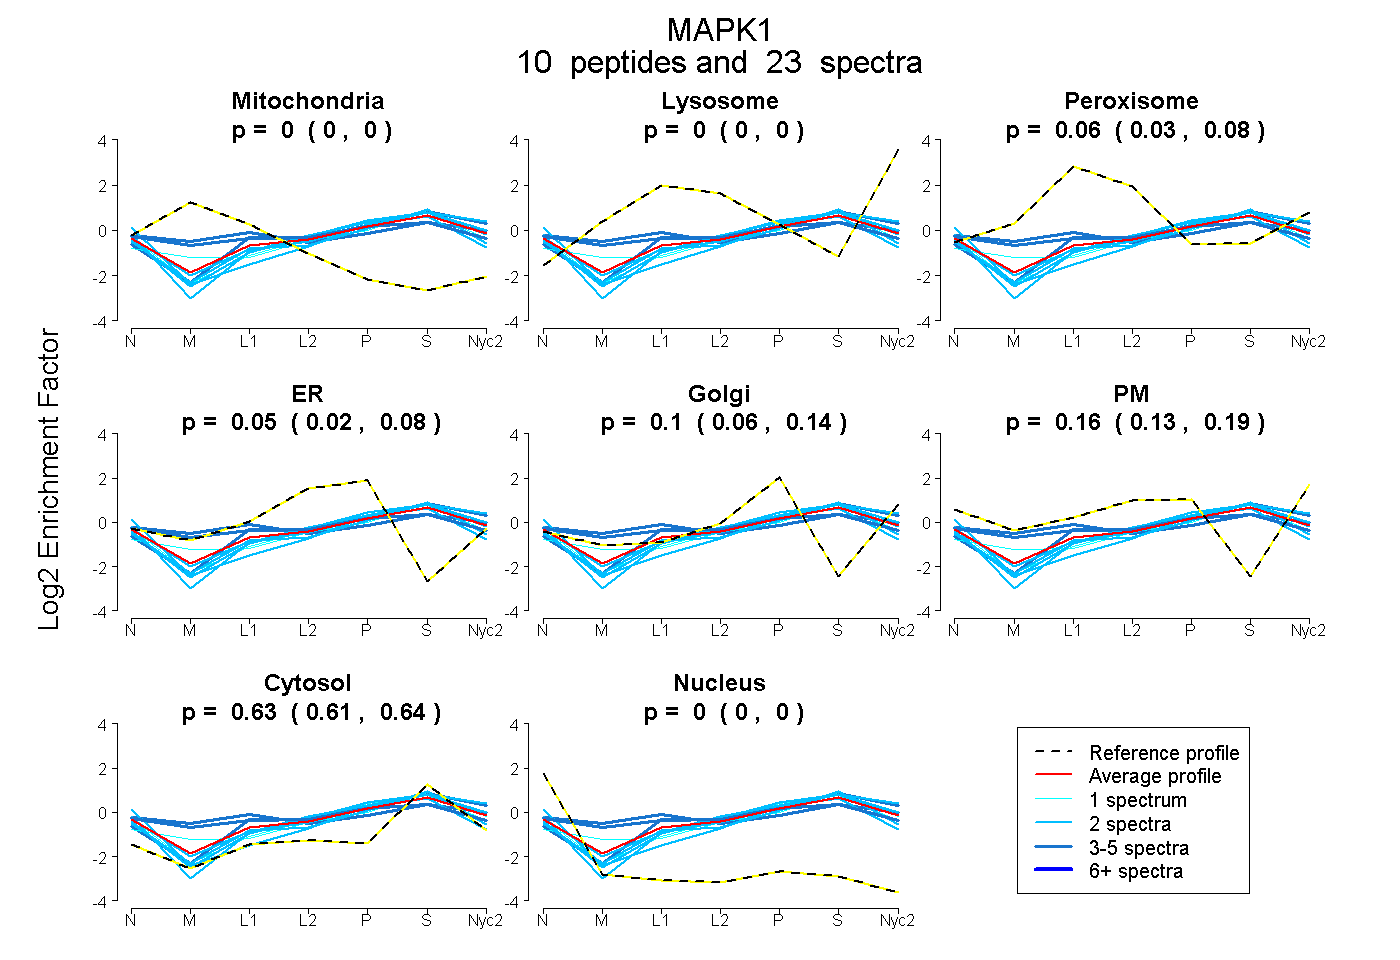
0.000 | 0.000
0.000 | 0.000
0.032 | 0.079
0.020 | 0.077
0.064 | 0.138
0.130 | 0.188
0.611 | 0.639
0.000 | 0.000
4peptides
spectra
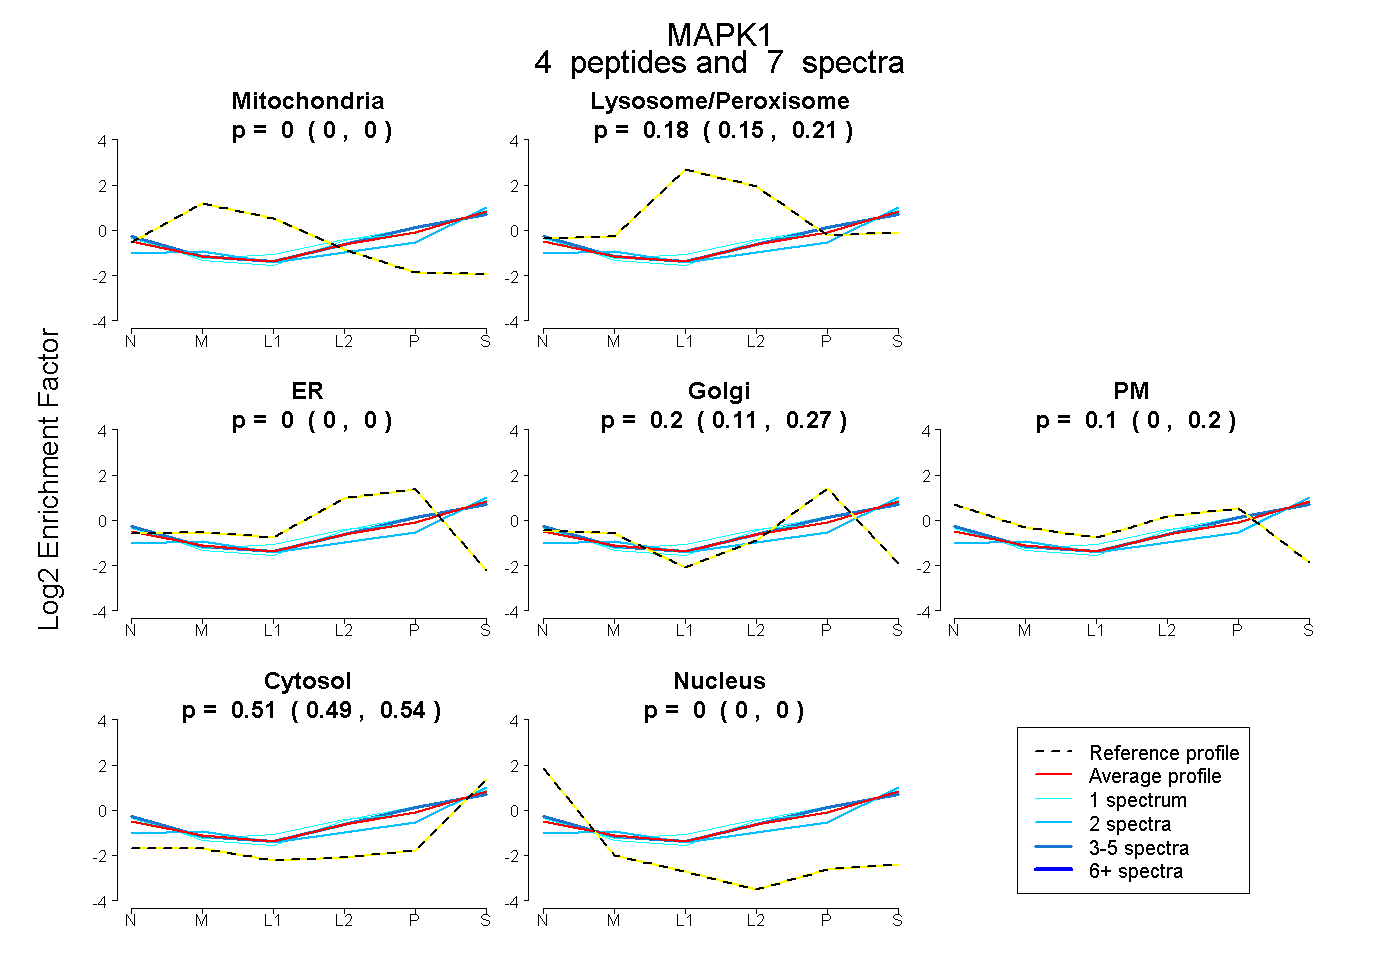
0.000 | 0.000
0.147 | 0.215
0.000 | 0.000
0.105 | 0.273
0.000 | 0.198
0.489 | 0.536
0.000 | 0.000
9peptides
spectra
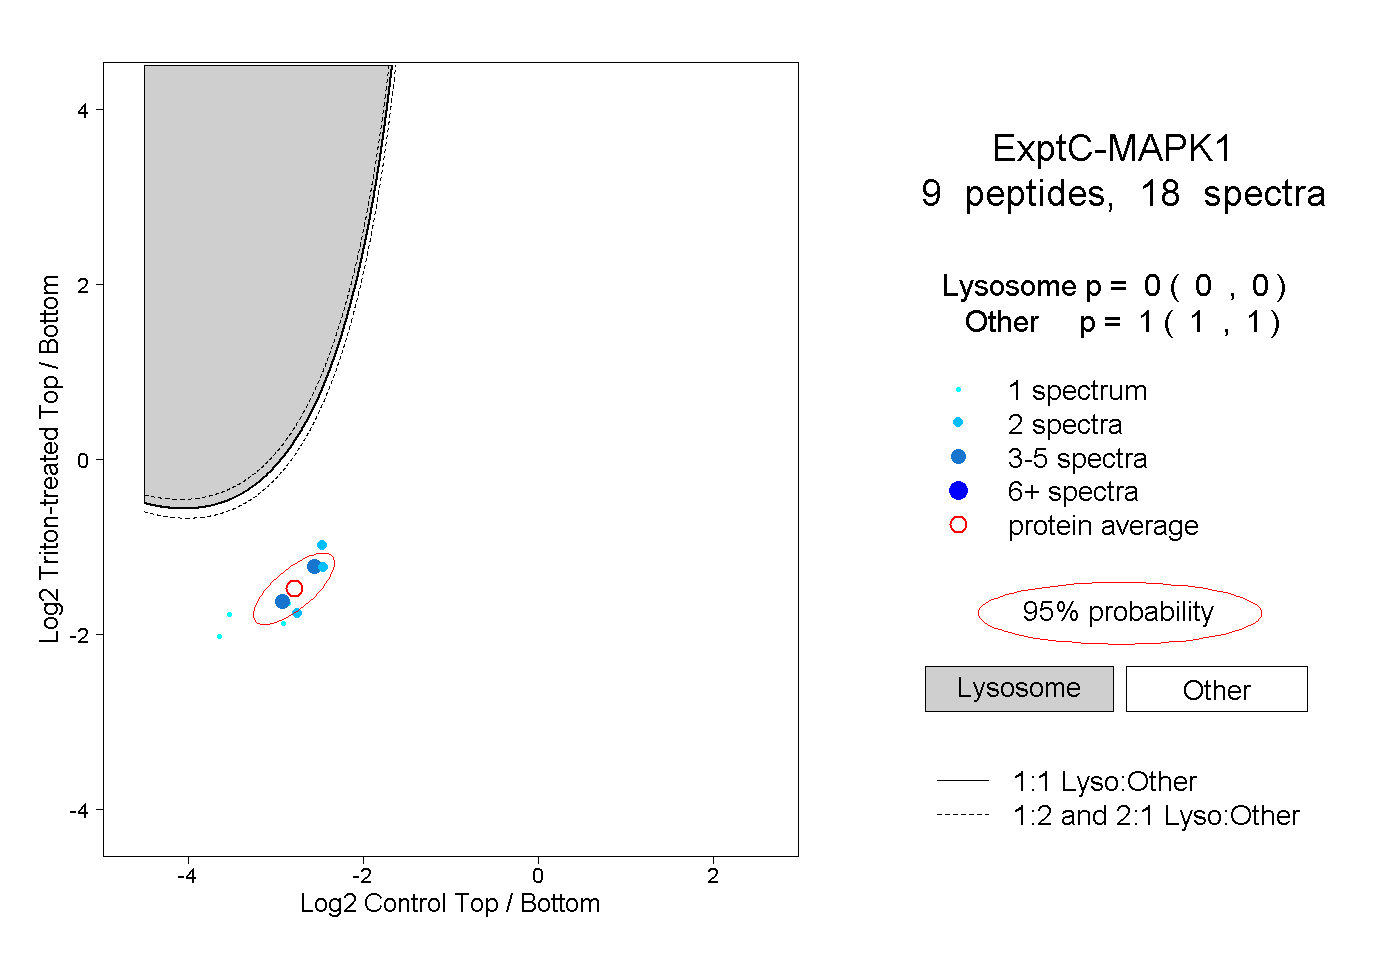
0.000 | 0.000
1.000 | 1.000
3peptides
spectra
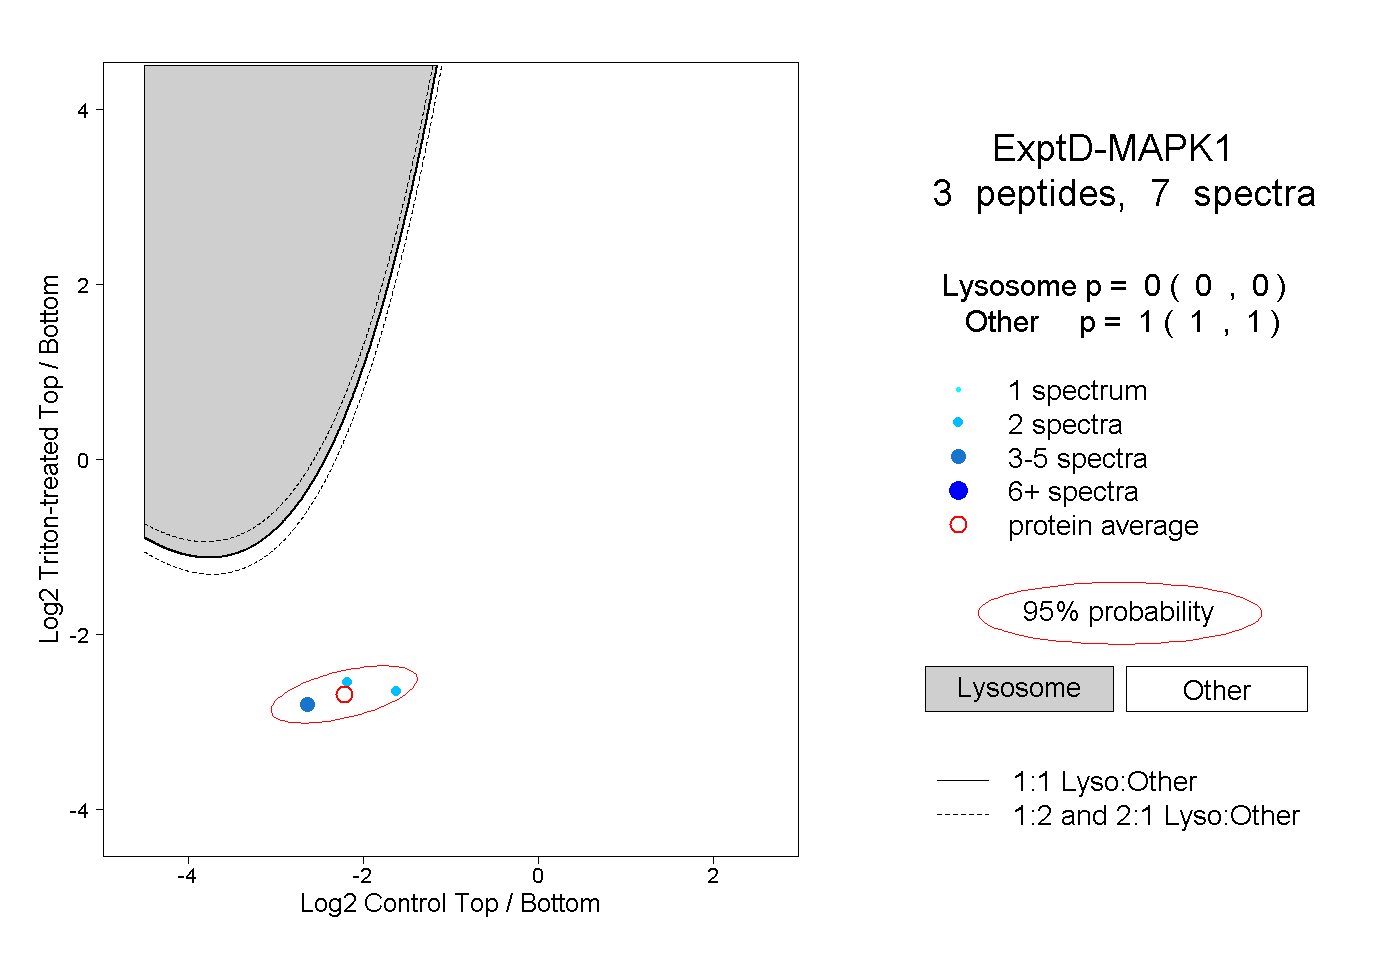
0.000 | 0.000
1.000 | 1.000