 10
10peptides
spectra
0.000 | 0.000
0.000 | 0.000
0.032 | 0.079
0.020 | 0.077
0.064 | 0.138
0.130 | 0.188
0.611 | 0.639
0.000 | 0.000
| Plot | Mito | Lyso | Perox | ER | Golgi | PM | Cytosol | Nucleus | |||||
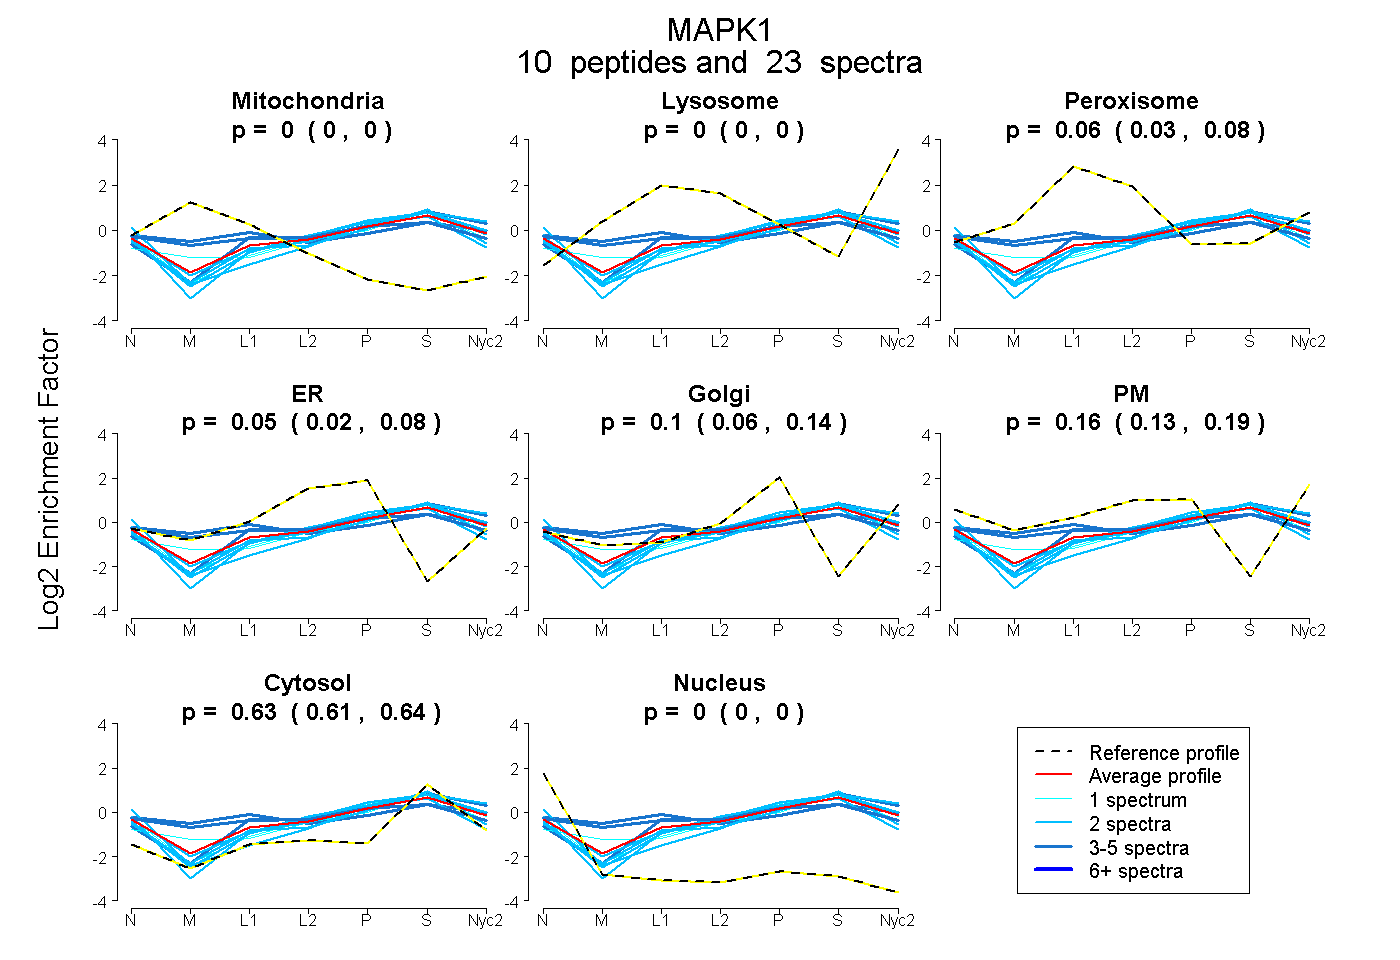
| Expt A |
10 peptides |
23 spectra |
|
0.000 0.000 | 0.000 |
0.000 0.000 | 0.000 |
0.058 0.032 | 0.079 |
0.051 0.020 | 0.077 |
0.103 0.064 | 0.138 |
0.162 0.130 | 0.188 |
0.626 0.611 | 0.639 |
0.000 0.000 | 0.000 |
| 2 spectra, ICDFGLAR | 0.000 | 0.000 | 0.000 | 0.082 | 0.140 | 0.125 | 0.654 | 0.000 | ||
| 2 spectra, NYLLSLPHK | 0.000 | 0.000 | 0.000 | 0.000 | 0.101 | 0.238 | 0.661 | 0.000 | ||
| 2 spectra, LFPNADSK | 0.000 | 0.000 | 0.000 | 0.093 | 0.209 | 0.000 | 0.641 | 0.057 | ||
| 3 spectra, DVYIVQDLMETDLYK | 0.071 | 0.000 | 0.208 | 0.000 | 0.065 | 0.186 | 0.470 | 0.000 | ||
| 3 spectra, APTIEQMK | 0.000 | 0.094 | 0.070 | 0.000 | 0.162 | 0.054 | 0.620 | 0.000 | ||
| 2 spectra, GQVFDVGPR | 0.000 | 0.000 | 0.000 | 0.062 | 0.053 | 0.217 | 0.667 | 0.000 | ||
| 1 spectrum, ALDLLDK | 0.000 | 0.000 | 0.000 | 0.144 | 0.141 | 0.048 | 0.666 | 0.000 | ||
| 5 spectra, YIHSANVLHR | 0.056 | 0.000 | 0.226 | 0.000 | 0.268 | 0.000 | 0.450 | 0.000 | ||
| 1 spectrum, FDMELDDLPK | 0.000 | 0.014 | 0.091 | 0.000 | 0.219 | 0.032 | 0.645 | 0.000 | ||
| 2 spectra, VADPDHDHTGFLTEYVATR | 0.000 | 0.000 | 0.024 | 0.148 | 0.087 | 0.015 | 0.726 | 0.000 |
| Plot | Mito | Lyso or Perox | ER | Golgi | PM | Cytosol | Nucleus | ||||||
| Expt B |
4 peptides |
7 spectra |
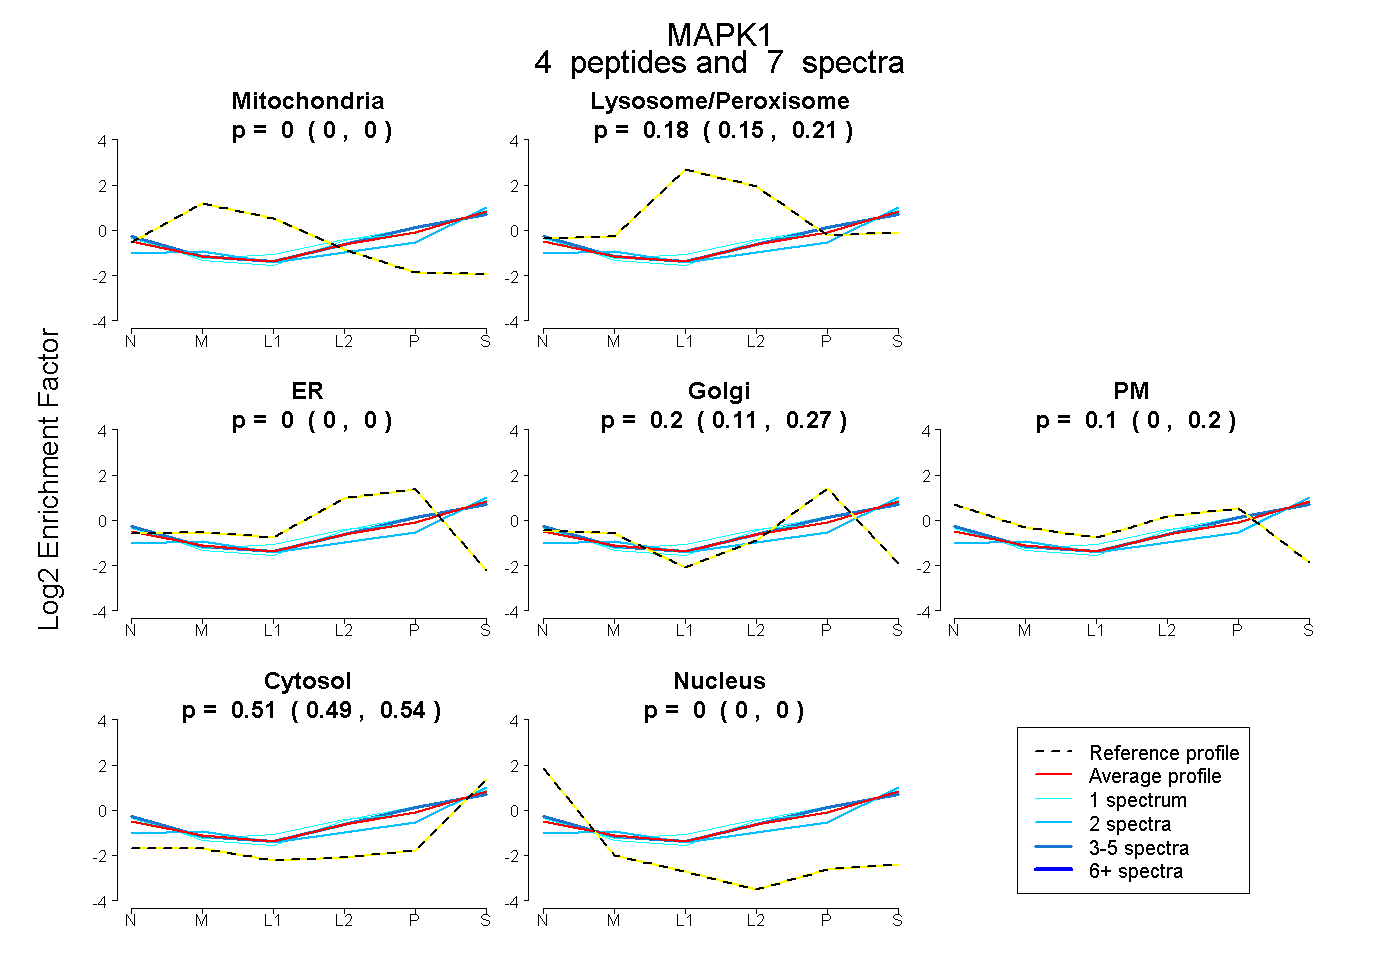 |
0.000 0.000 | 0.000 |
0.185 0.147 | 0.215 |
0.000 0.000 | 0.000 |
0.198 0.105 | 0.273 |
0.103 0.000 | 0.198 |
0.514 0.489 | 0.536 |
0.000 0.000 | 0.000 |
|||
| Plot | Lyso | Other | |||||||||||
| Expt C |
9 peptides |
18 spectra |
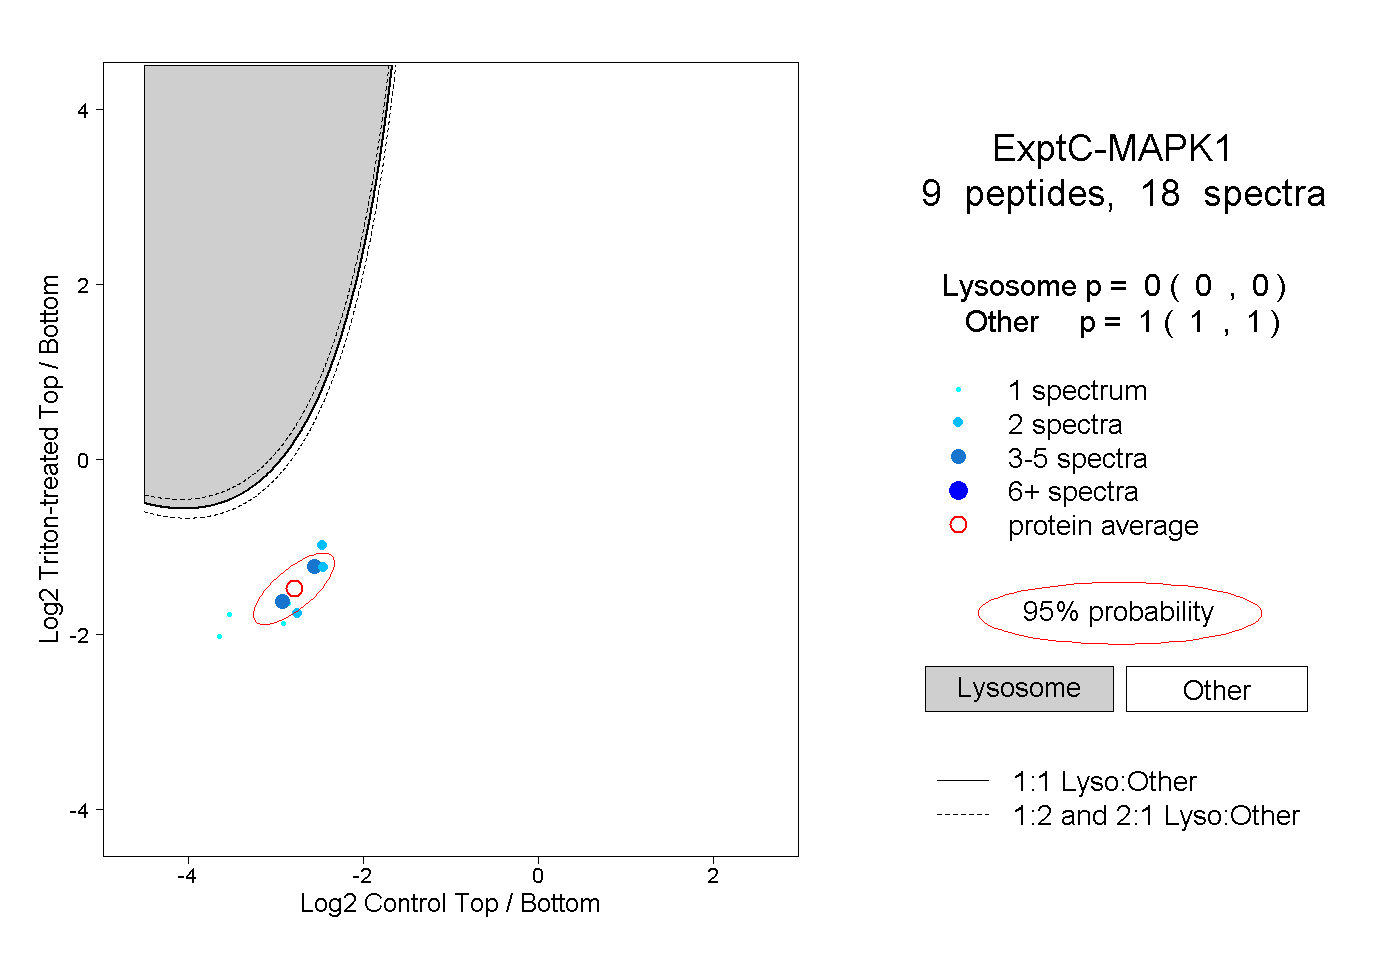 |
0.000 0.000 | 0.000 |
1.000 1.000 | 1.000 |
||||||||
| Plot | Lyso | Other | |||||||||||
| Expt D |
3 peptides |
7 spectra |
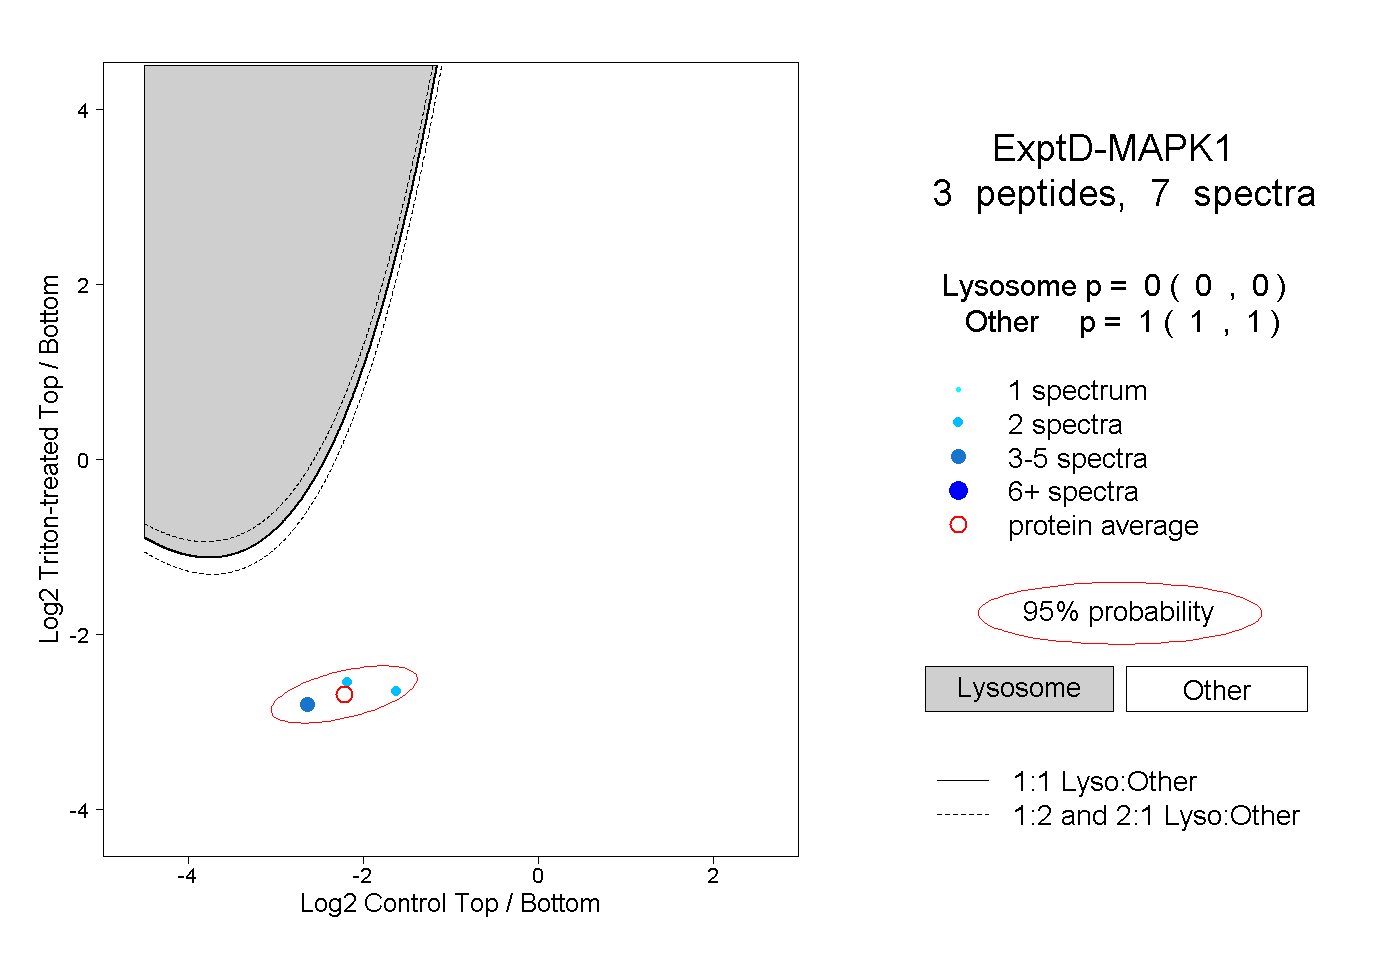 |
0.000 0.000 | 0.000 |
1.000 1.000 | 1.000 |