 6
6peptides
spectra
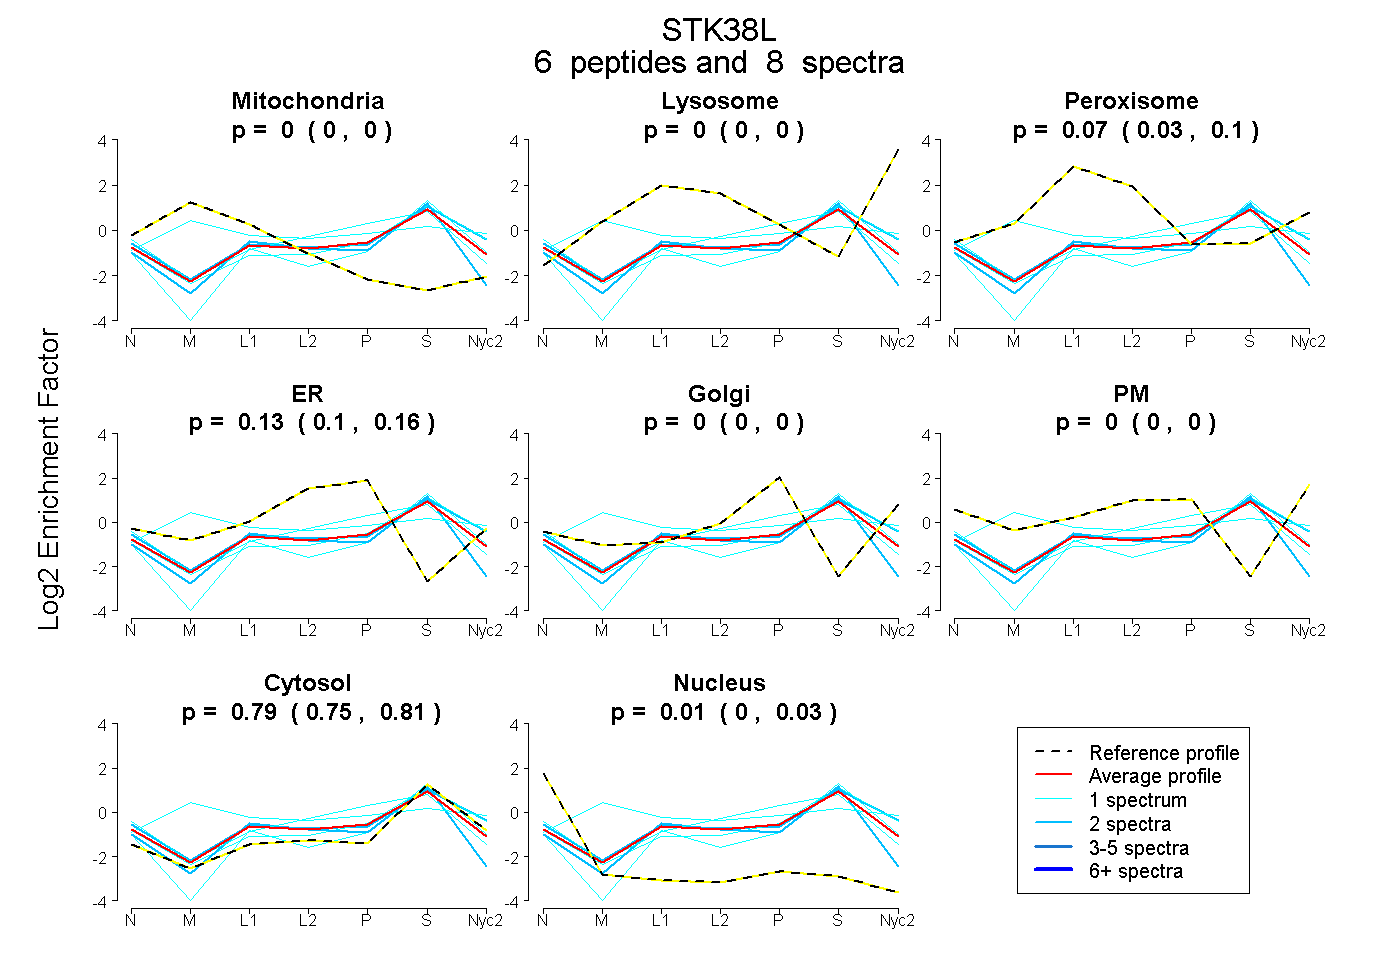
0.000 | 0.000
0.000 | 0.000
0.031 | 0.104
0.096 | 0.156
0.000 | 0.000
0.000 | 0.000
0.751 | 0.813
0.000 | 0.033
1peptide
spectrum
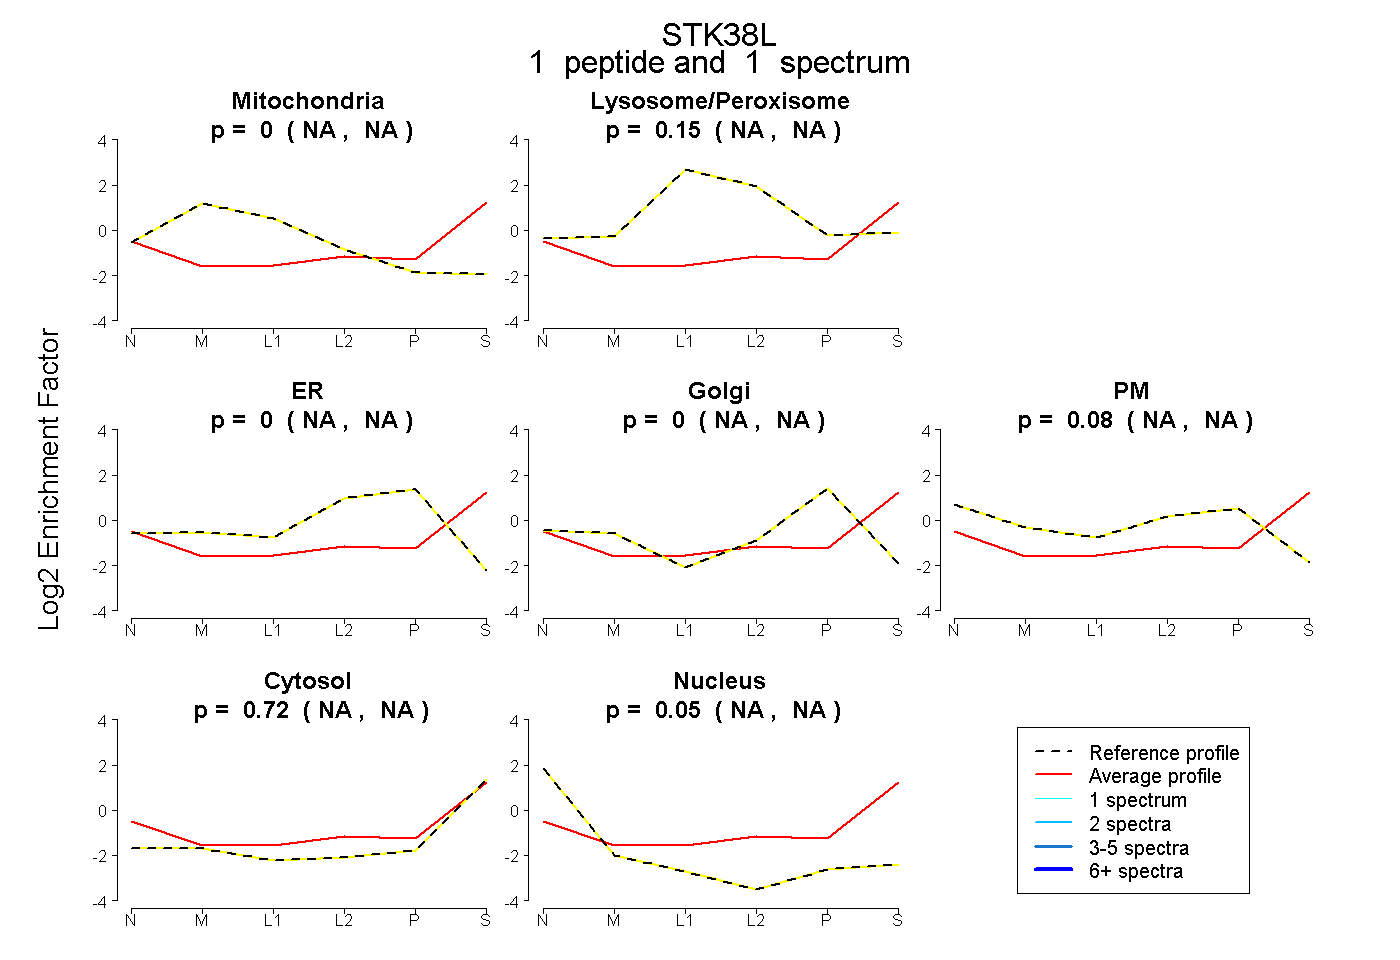
NA | NA
NA | NA
NA | NA
NA | NA
NA | NA
NA | NA
NA | NA
2peptides
spectra
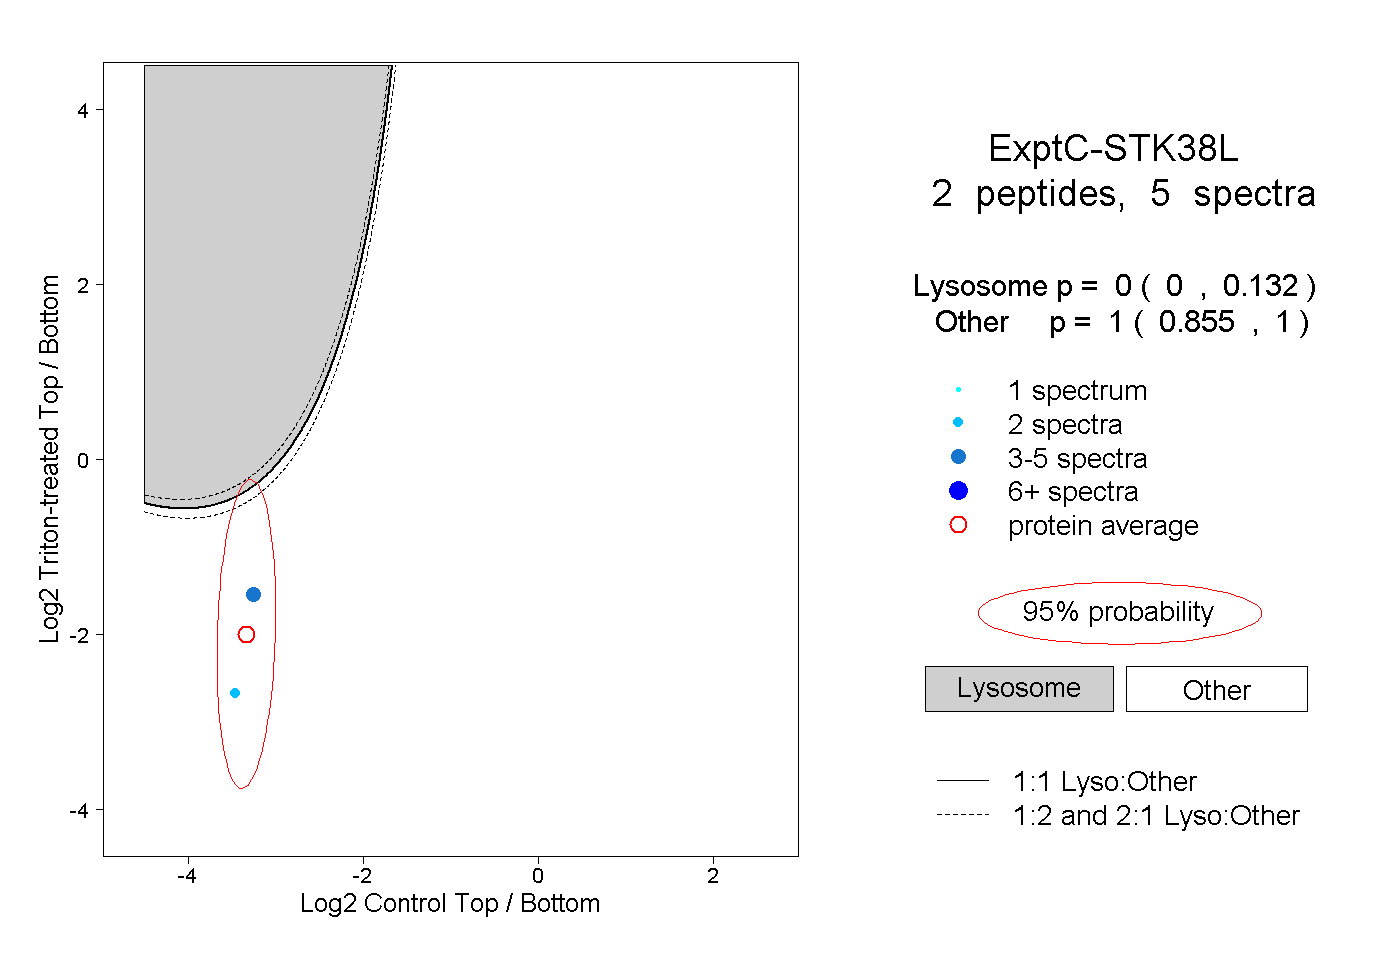
0.000 | 0.132
0.855 | 1.000