 6
6peptides
spectra
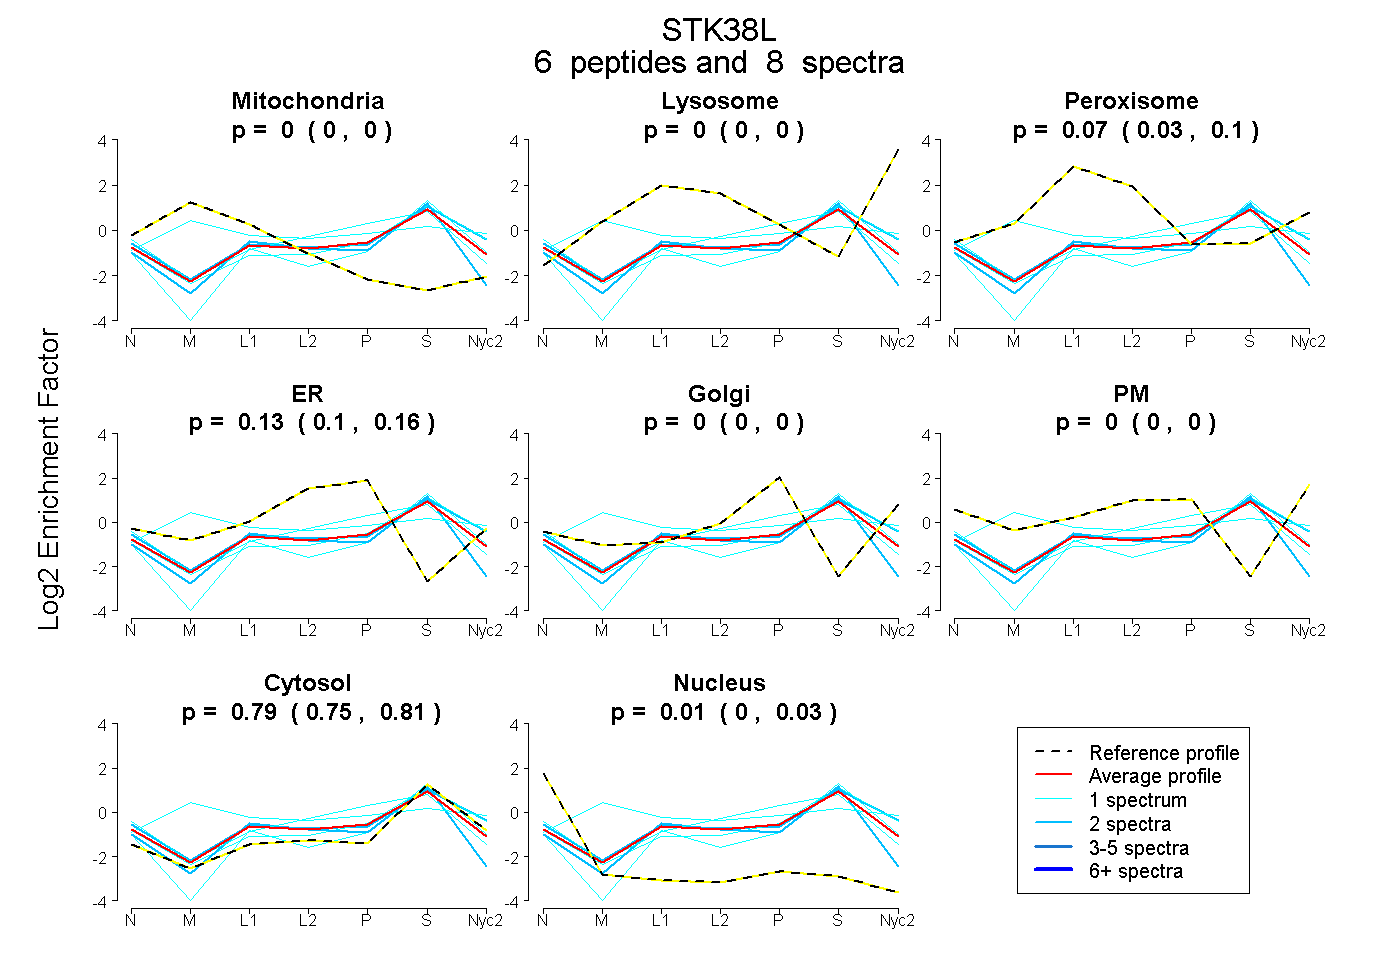
0.000 | 0.000
0.000 | 0.000
0.031 | 0.104
0.096 | 0.156
0.000 | 0.000
0.000 | 0.000
0.751 | 0.813
0.000 | 0.033
| Plot | Mito | Lyso | Perox | ER | Golgi | PM | Cytosol | Nucleus | |||||
| Expt A |
6 peptides |
8 spectra |
|
0.000 0.000 | 0.000 |
0.000 0.000 | 0.000 |
0.072 0.031 | 0.104 |
0.129 0.096 | 0.156 |
0.000 0.000 | 0.000 |
0.000 0.000 | 0.000 |
0.786 0.751 | 0.813 |
0.014 0.000 | 0.033 |
| 2 spectra, ERPAAIPIEIR | 0.000 | 0.000 | 0.100 | 0.000 | 0.000 | 0.125 | 0.775 | 0.000 | ||
| 1 spectrum, LSDFGLCTGLK | 0.000 | 0.000 | 0.000 | 0.303 | 0.000 | 0.000 | 0.697 | 0.000 | ||
| 1 spectrum, GAFGEVR | 0.000 | 0.000 | 0.000 | 0.000 | 0.065 | 0.096 | 0.839 | 0.000 | ||
| 2 spectra, LGLDDFESLK | 0.000 | 0.000 | 0.067 | 0.031 | 0.000 | 0.000 | 0.816 | 0.085 | ||
| 1 spectrum, GHPFFEGVDWGHIR | 0.000 | 0.000 | 0.000 | 0.000 | 0.000 | 0.000 | 0.980 | 0.020 | ||
| 1 spectrum, MFYSFQDK | 0.226 | 0.166 | 0.117 | 0.000 | 0.128 | 0.000 | 0.363 | 0.000 |
| Plot | Mito | Lyso or Perox | ER | Golgi | PM | Cytosol | Nucleus | ||||||
| Expt B |
1 peptide |
1 spectrum |
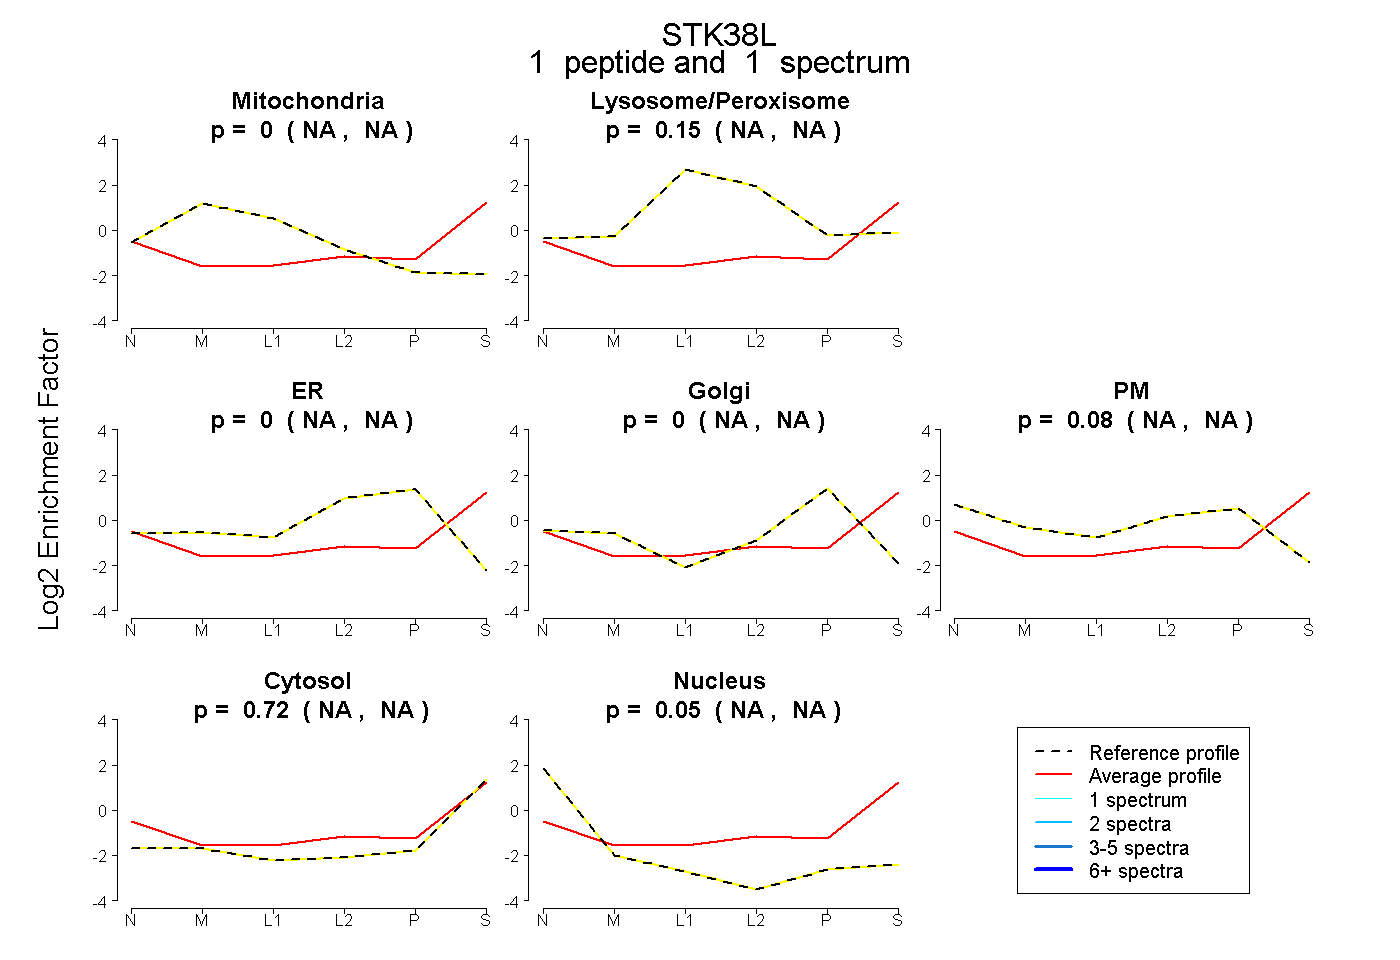 |
0.000 NA | NA |
0.151 NA | NA |
0.000 NA | NA |
0.000 NA | NA |
0.078 NA | NA |
0.721 NA | NA |
0.049 NA | NA |
|||
| Plot | Lyso | Other | |||||||||||
| Expt C |
2 peptides |
5 spectra |
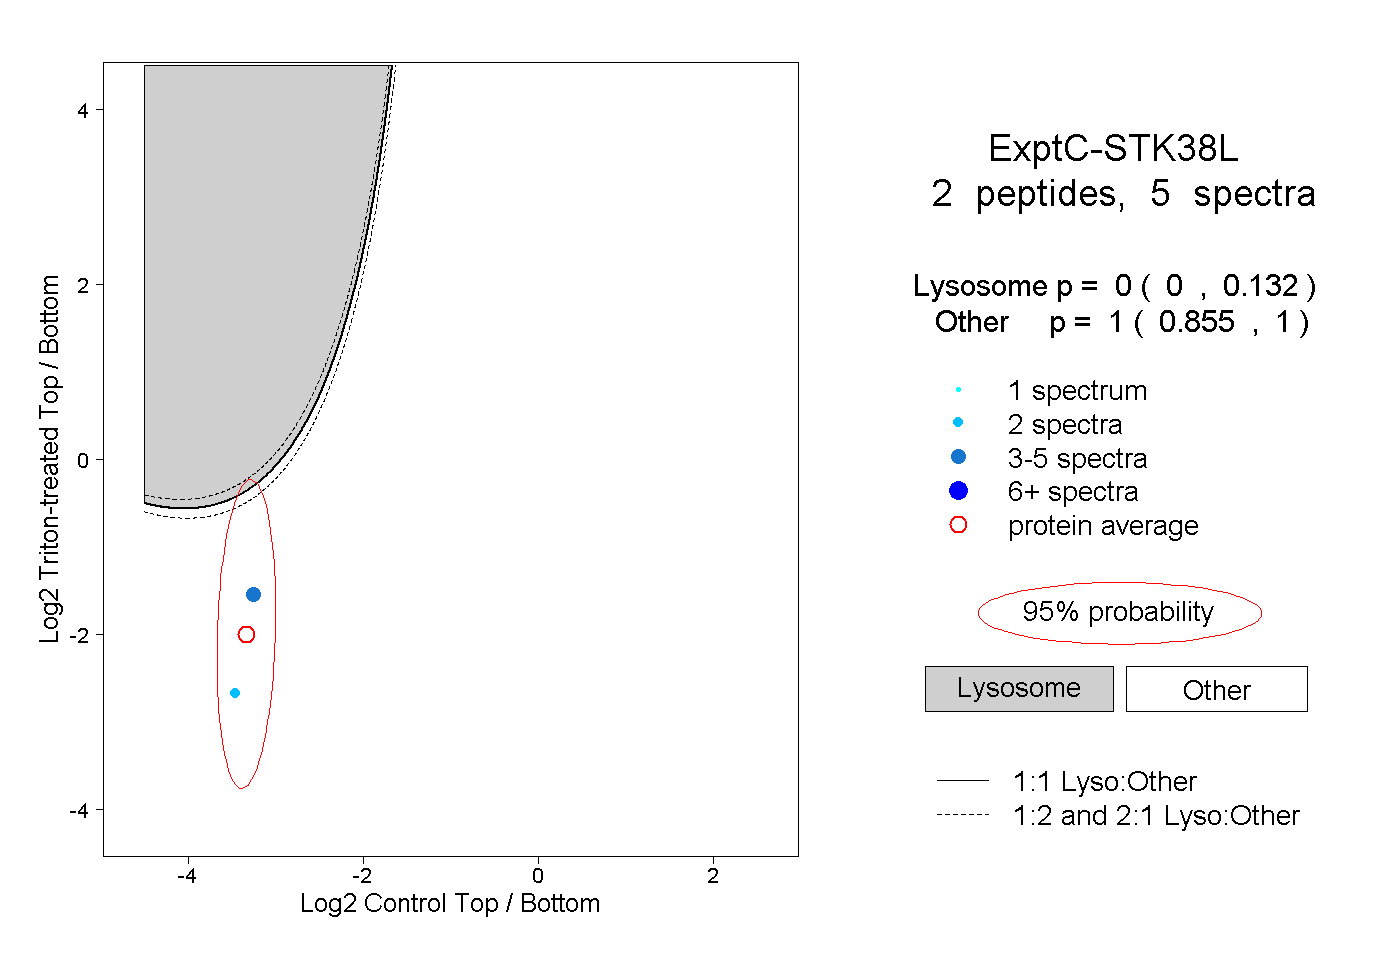 |
0.000 0.000 | 0.132 |
1.000 0.855 | 1.000 |