 22
22peptides
spectra
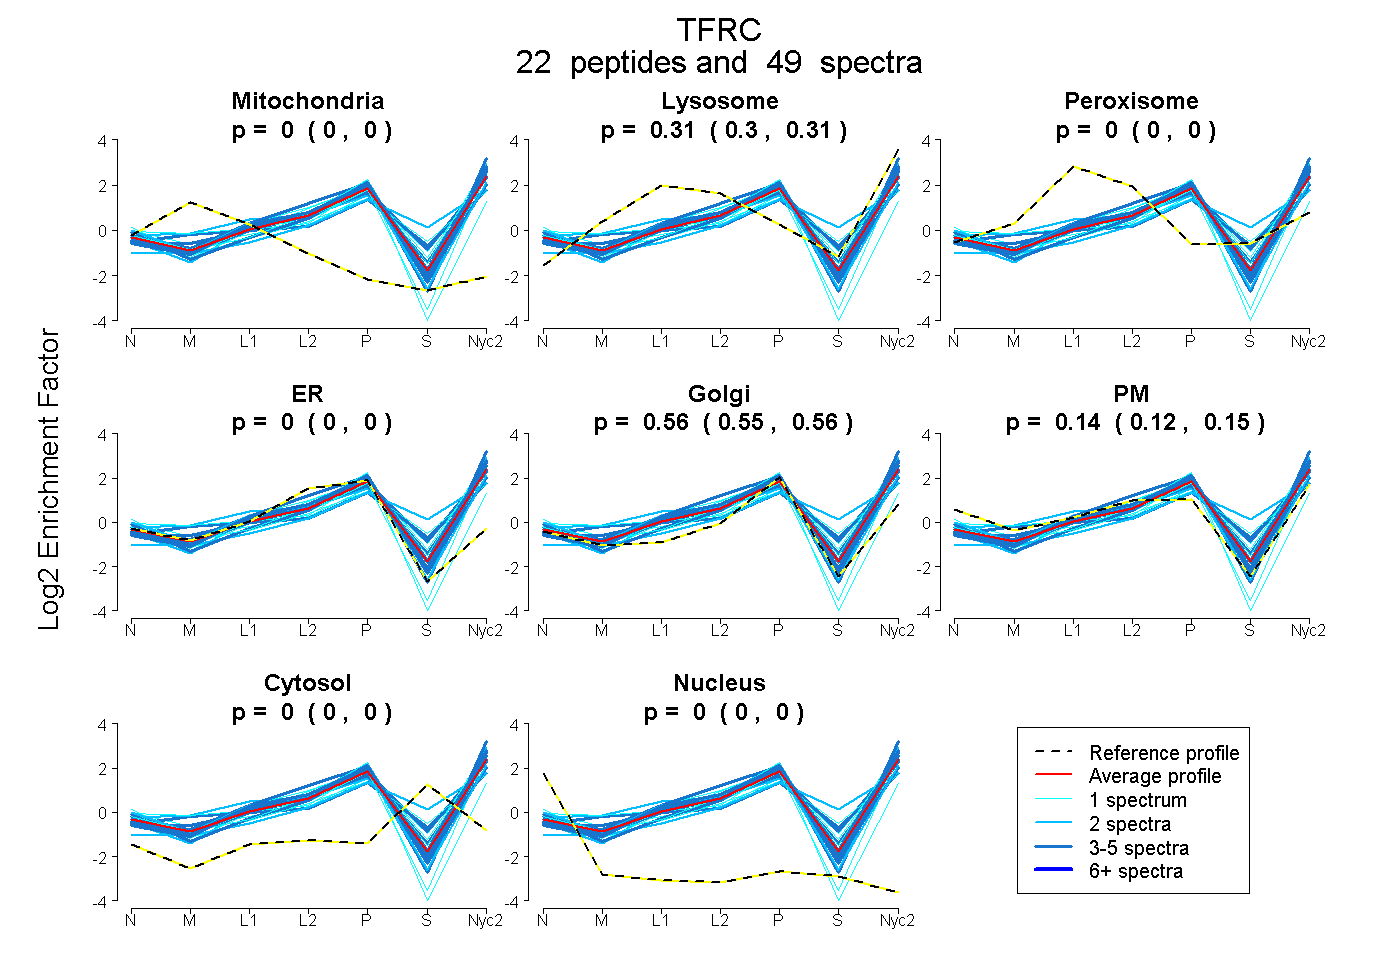
0.000 | 0.000
0.300 | 0.314
0.000 | 0.000
0.000 | 0.000
0.548 | 0.564
0.122 | 0.147
0.000 | 0.000
0.000 | 0.000
7peptides
spectra
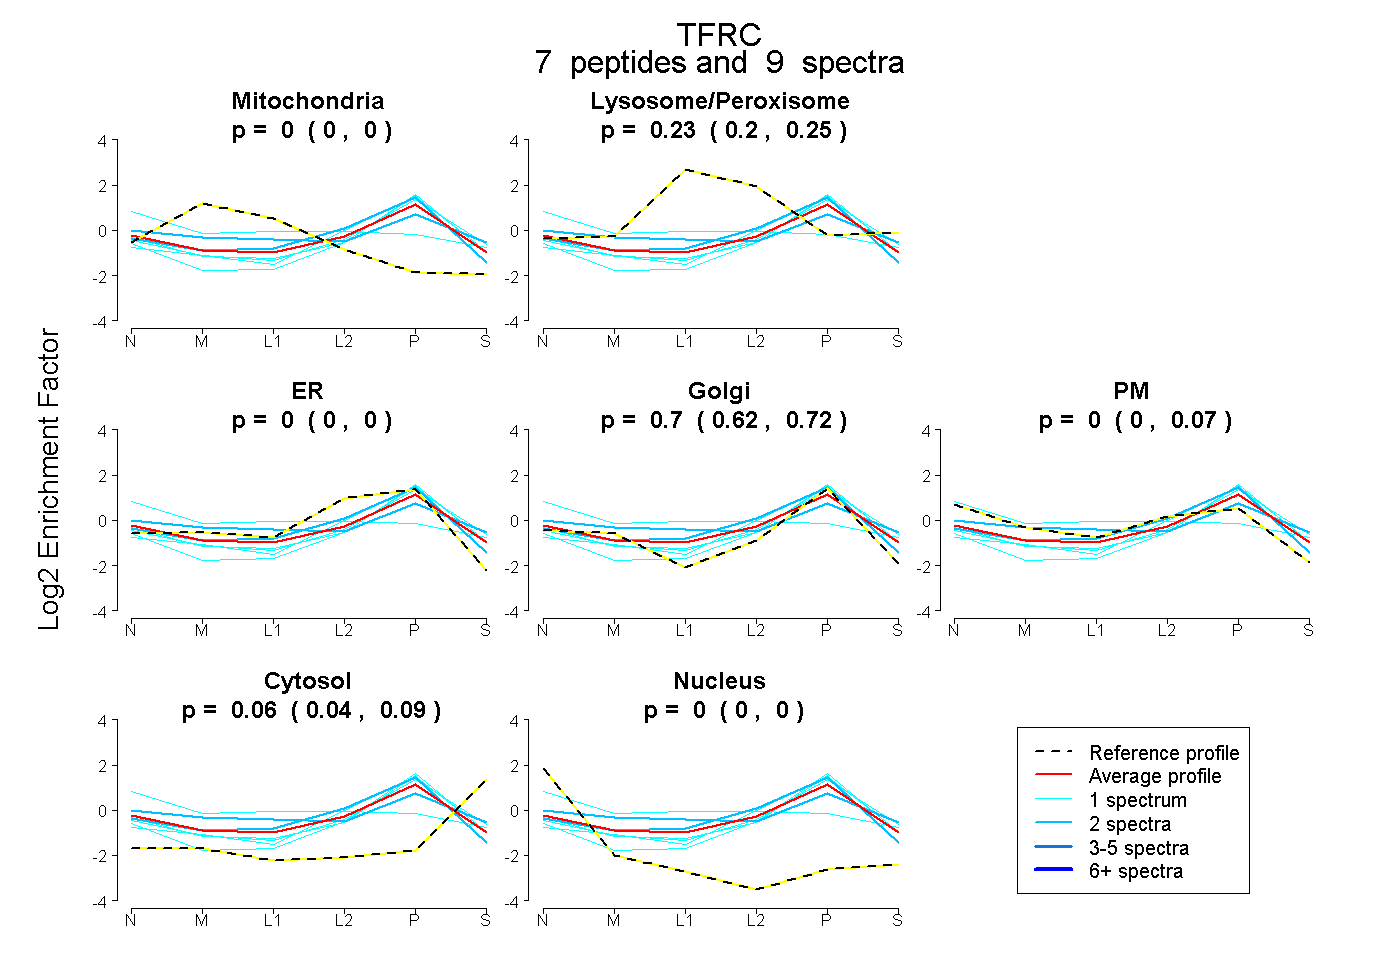
0.000 | 0.000
0.199 | 0.251
0.000 | 0.000
0.621 | 0.725
0.000 | 0.070
0.040 | 0.088
0.000 | 0.000
22peptides
spectra
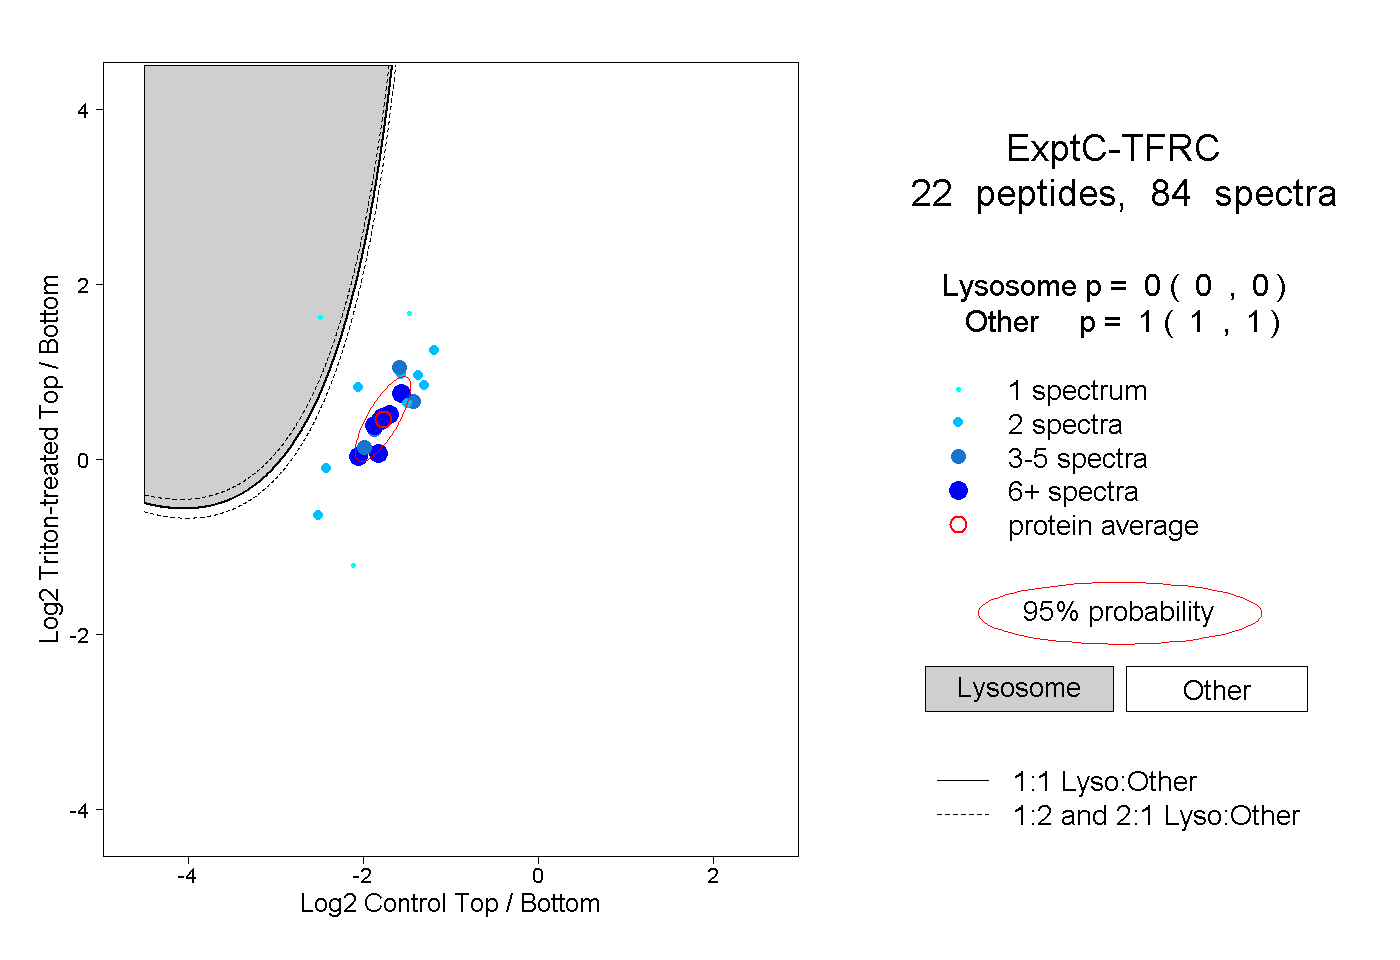
0.000 | 0.000
1.000 | 1.000
5peptides
spectra
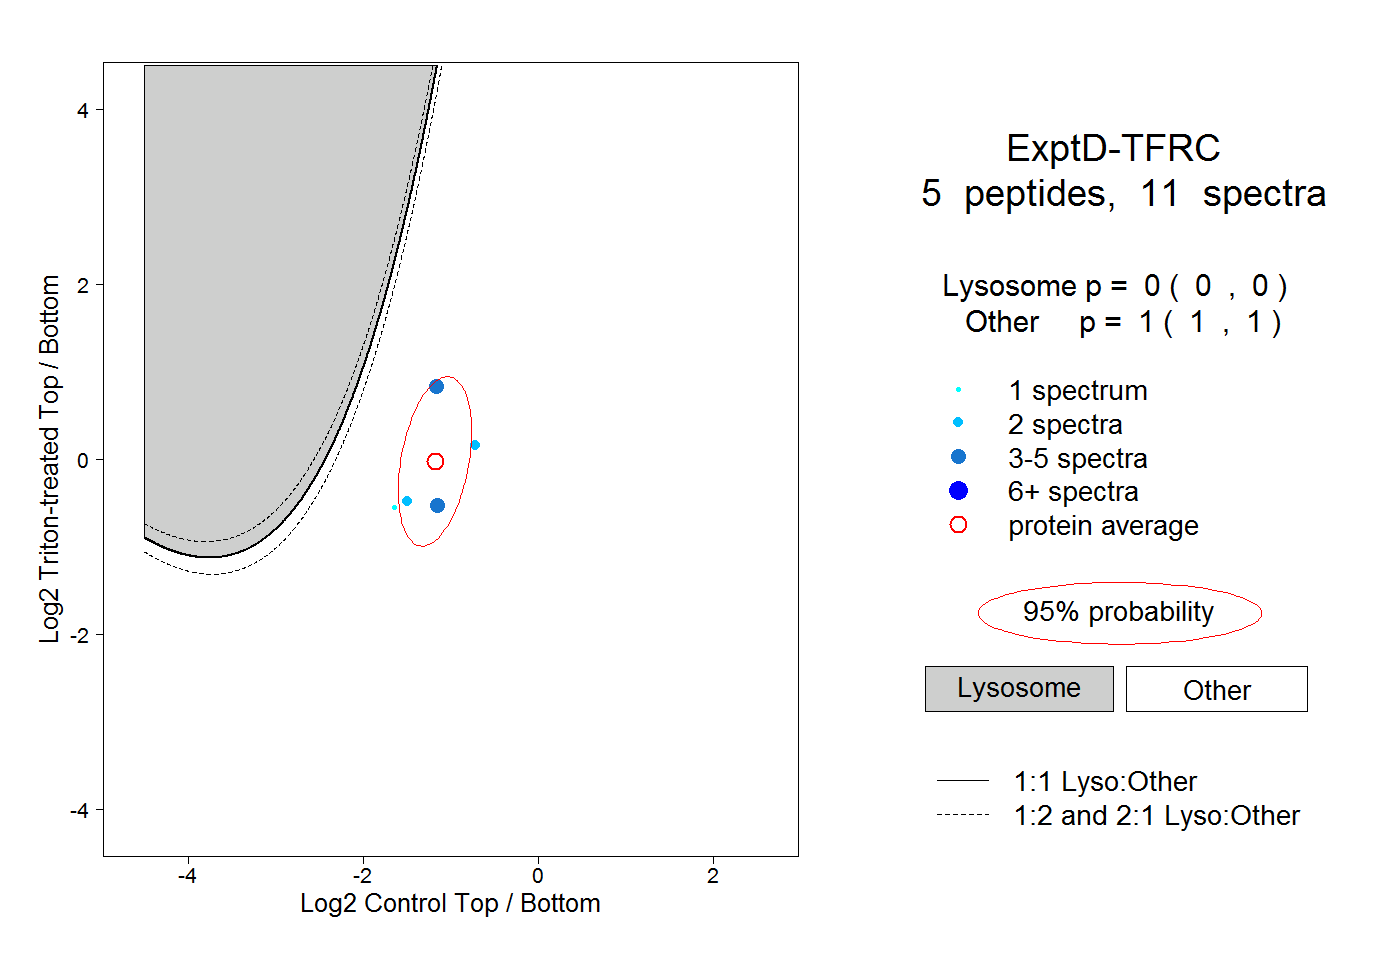
0.000 | 0.000
1.000 | 1.000