TFRC
[ENSRNOP00000002407]
Main page
| | | Plot |
Mito |
Lyso |
|
Perox |
ER |
Golgi |
PM |
Cytosol |
Nucleus |
|
| Expt A |
 22
22
peptides |
49
spectra |
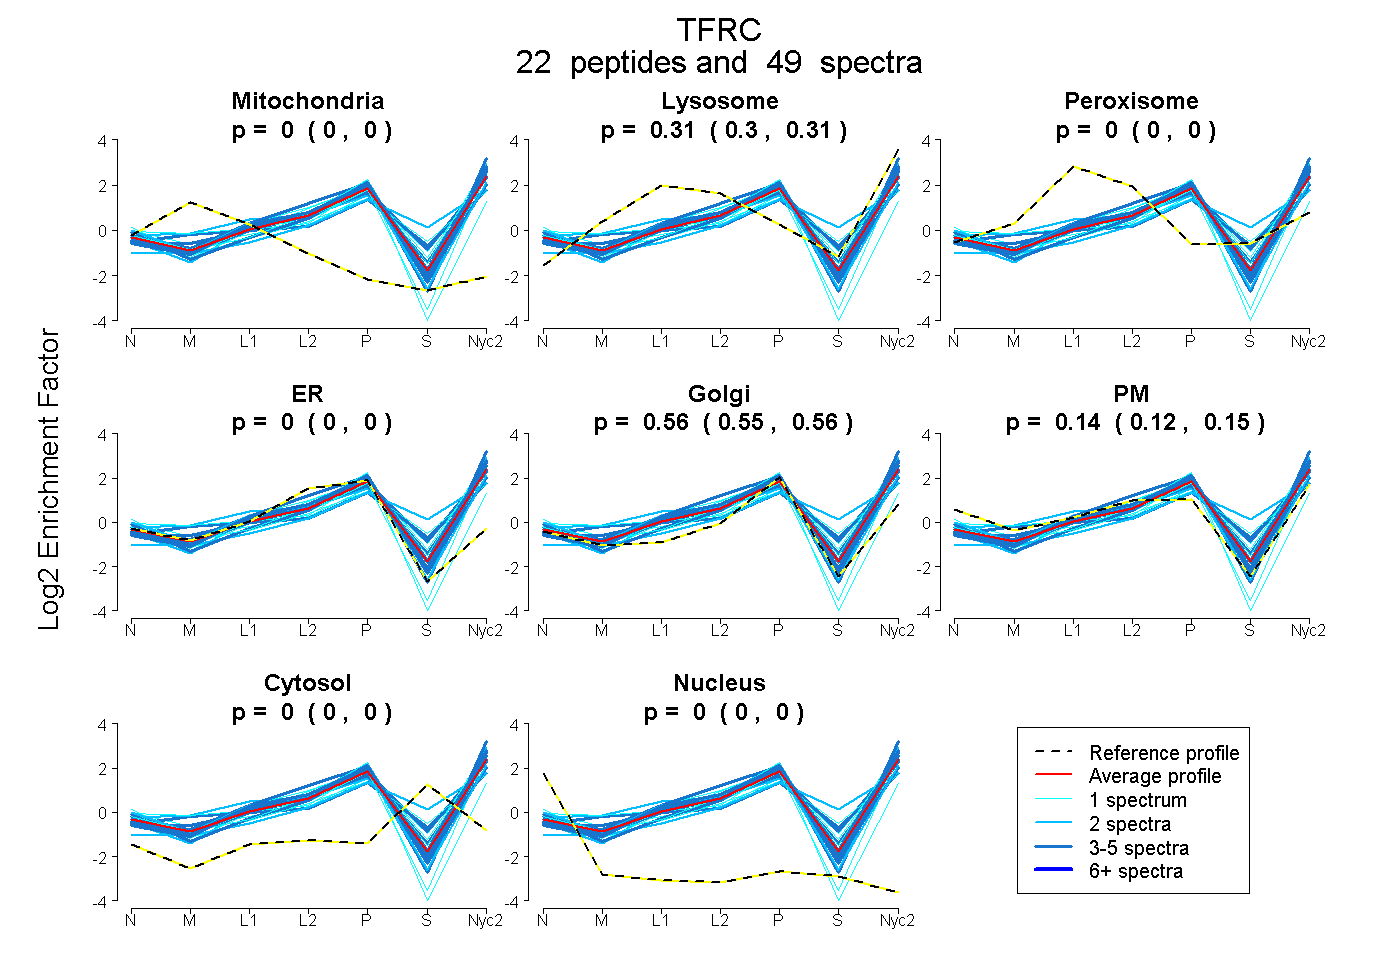 |
0.000
0.000 | 0.000 |
0.308
0.300 | 0.314 |
|
0.000
0.000 | 0.000 |
0.000
0.000 | 0.000 |
0.556
0.548 | 0.564 |
0.136
0.122 | 0.147 |
0.000
0.000 | 0.000 |
0.000
0.000 | 0.000 |
|
| | | Plot |
Mito |
|
Lyso or Perox |
|
ER |
Golgi |
PM |
Cytosol |
Nucleus |
|
| Expt B |
7
peptides |
9
spectra |
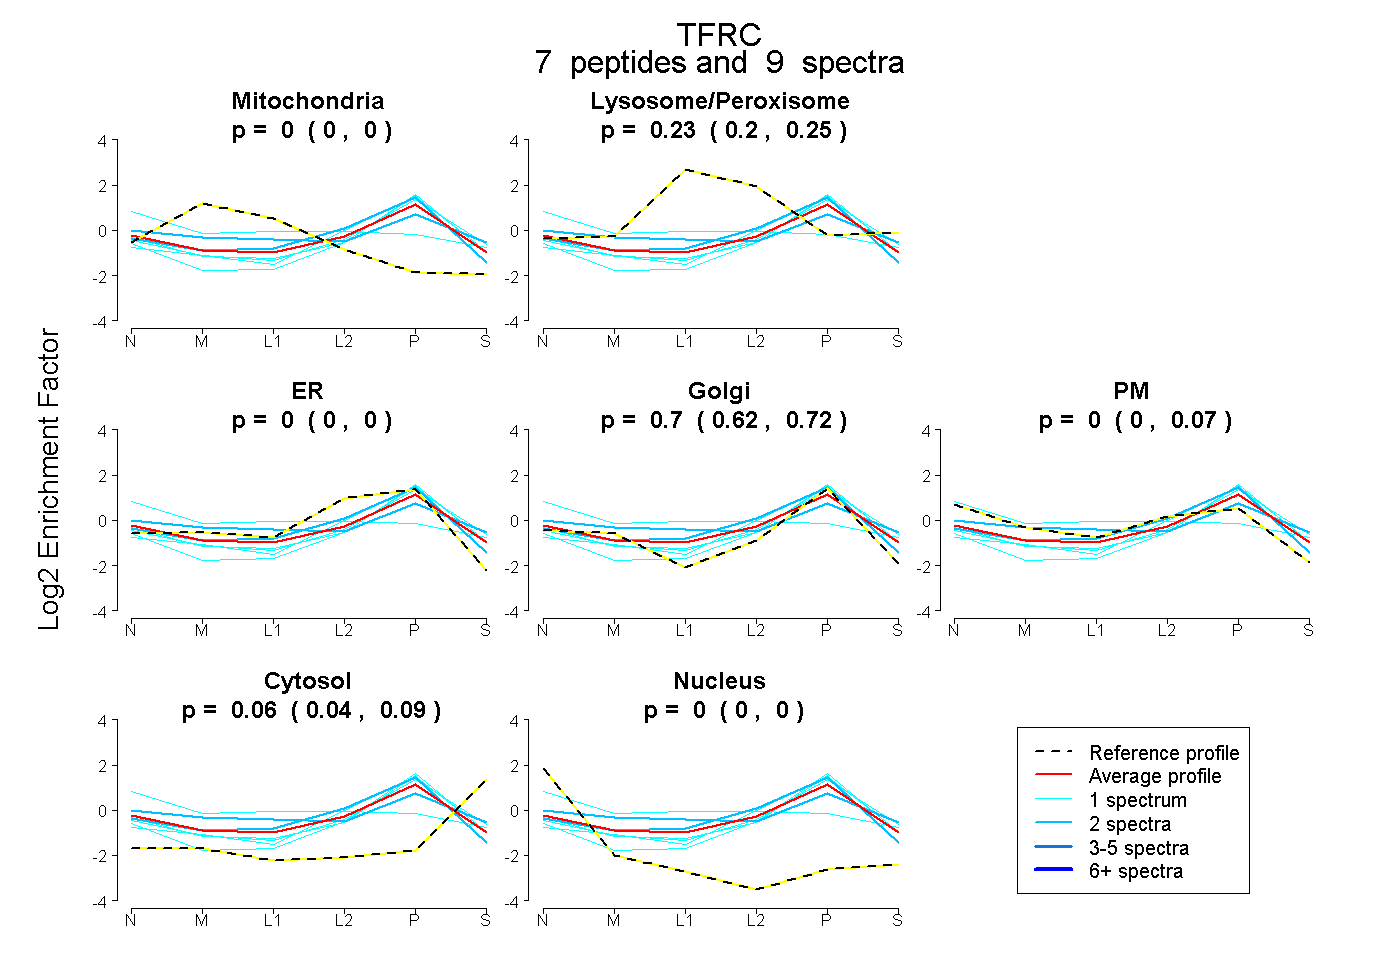 |
0.000
0.000 | 0.000 |
|
0.234
0.199 | 0.251 |
|
0.000
0.000 | 0.000 |
0.702
0.621 | 0.725 |
0.000
0.000 | 0.070 |
0.064
0.040 | 0.088 |
0.000
0.000 | 0.000 |
|
| 2 spectra, VVLGTSNFK |
0.000 |
|
0.272 |
|
0.000 |
0.400 |
0.192 |
0.136 |
0.000 |
|
| 2 spectra, TAAEVAGQFIIK |
0.000 |
|
0.197 |
|
0.209 |
0.594 |
0.000 |
0.000 |
0.000 |
|
| 1 spectrum, LELSQNQNVK |
0.024 |
|
0.288 |
|
0.000 |
0.000 |
0.514 |
0.065 |
0.109 |
|
| 1 spectrum, LNSIEFTDIIK |
0.000 |
|
0.174 |
|
0.000 |
0.699 |
0.000 |
0.126 |
0.000 |
|
| 1 spectrum, LDTYEILIQK |
0.000 |
|
0.145 |
|
0.000 |
0.853 |
0.000 |
0.002 |
0.000 |
|
| 1 spectrum, LFWADLK |
0.000 |
|
0.000 |
|
0.259 |
0.576 |
0.000 |
0.165 |
0.000 |
|
| 1 spectrum, LAQVFSDMISK |
0.000 |
|
0.001 |
|
0.500 |
0.331 |
0.000 |
0.168 |
0.000 |
|
| | | Plot |
|
Lyso |
|
|
|
|
|
|
|
Other |
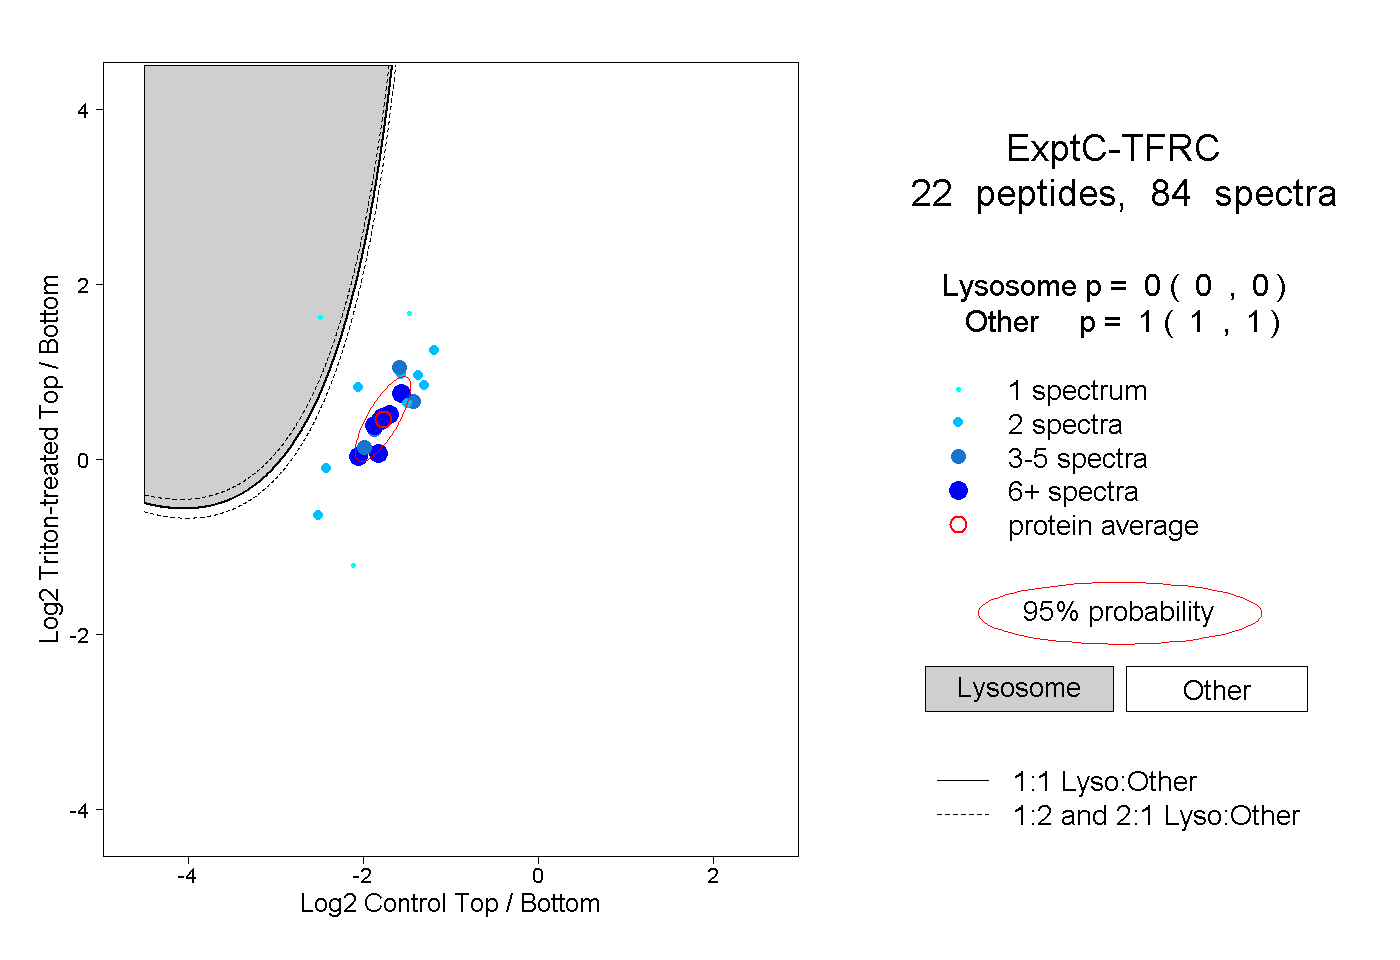
| Expt C |
22
peptides |
84
spectra |
 |
|
0.000
0.000 | 0.000 |
|
|
|
|
|
|
|
1.000
1.000 | 1.000 |
| | | Plot |
|
Lyso |
|
|
|
|
|
|
|
Other |
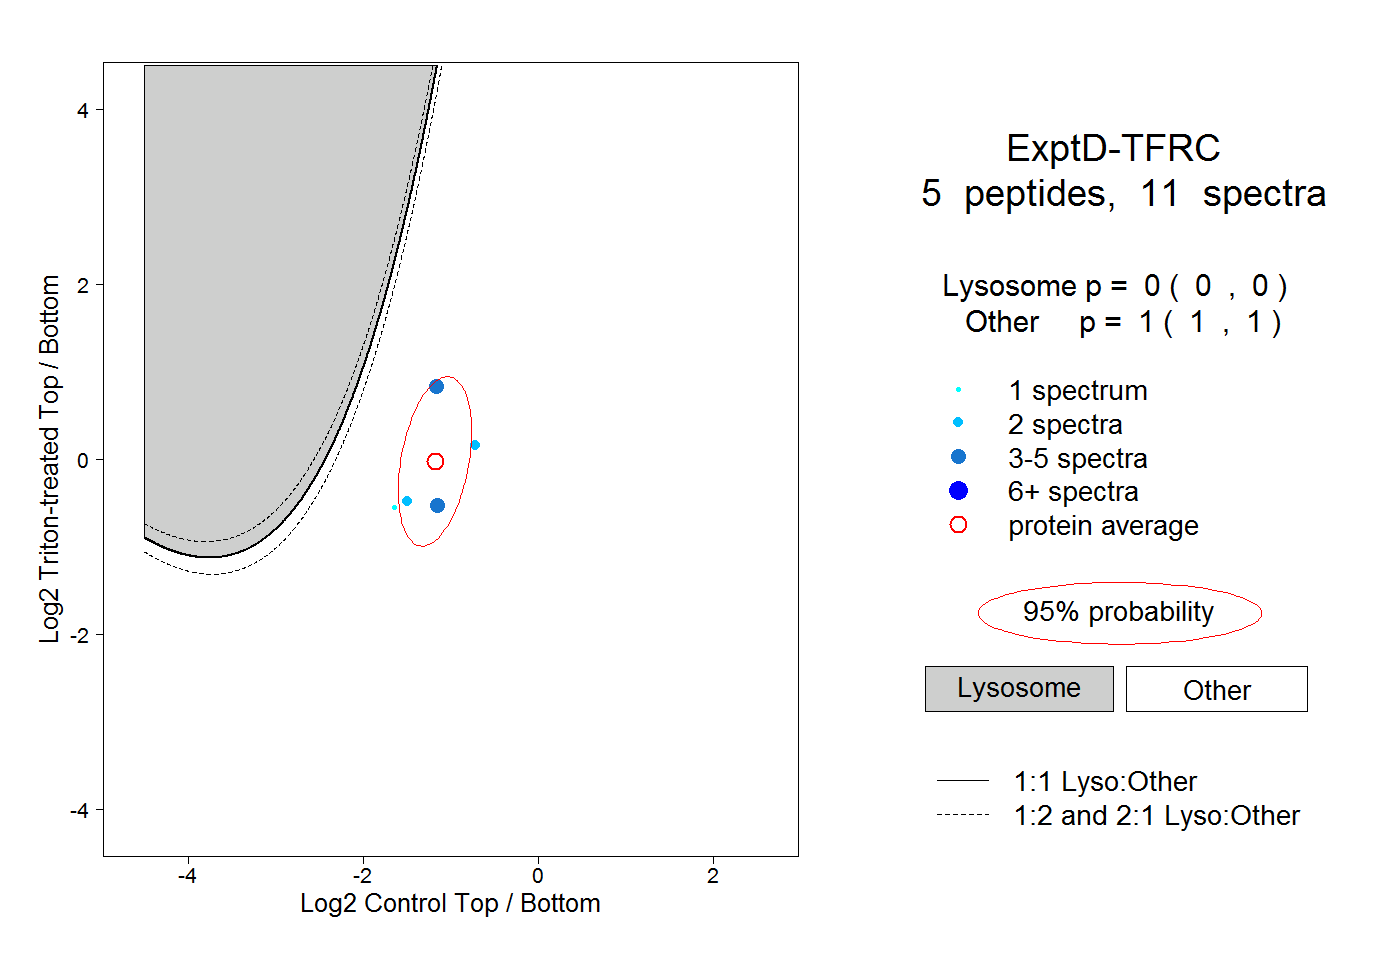
| Expt D |
5
peptides |
11
spectra |
 |
|
0.000
0.000 | 0.000 |
|
|
|
|
|
|
|
1.000
1.000 | 1.000 |