 7
7peptides
spectra
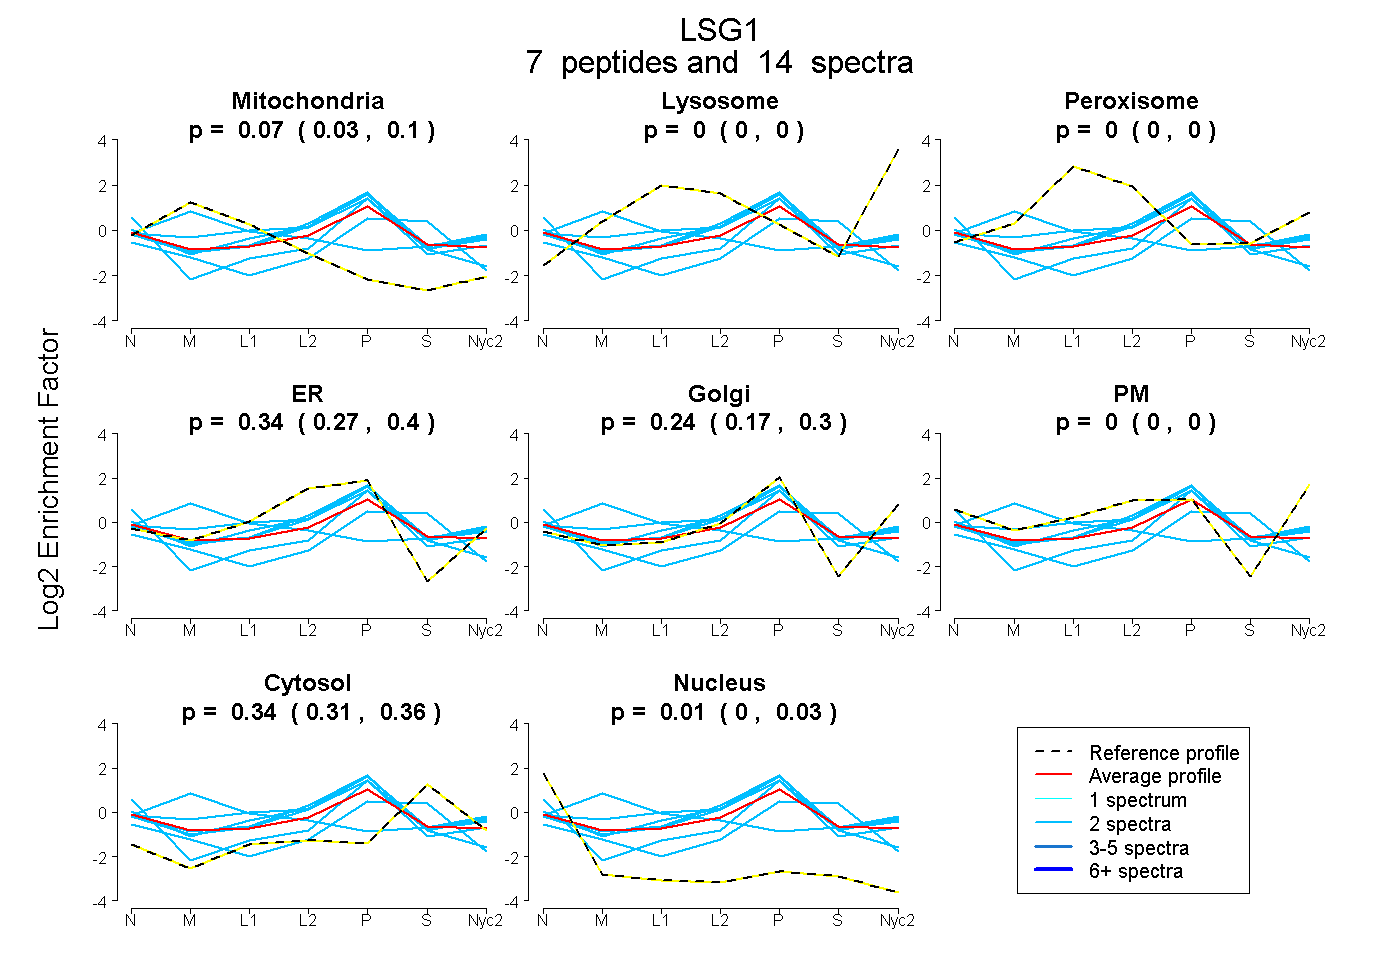
0.027 | 0.101
0.000 | 0.000
0.000 | 0.004
0.273 | 0.398
0.166 | 0.302
0.000 | 0.000
0.313 | 0.359
0.000 | 0.028
1peptide
spectrum
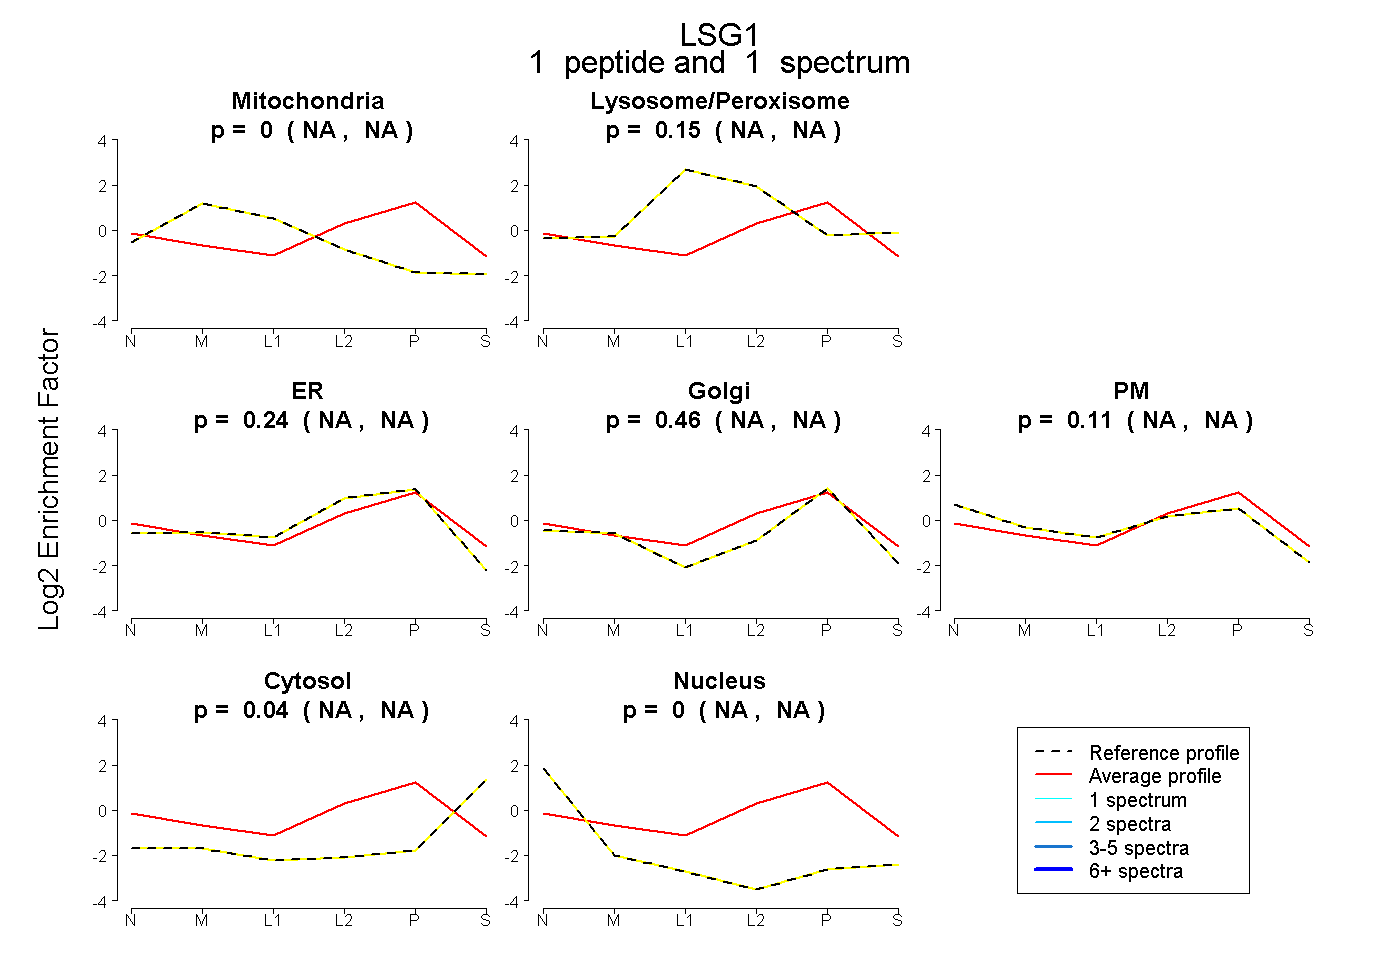
NA | NA
NA | NA
NA | NA
NA | NA
NA | NA
NA | NA
NA | NA
2peptides
spectra
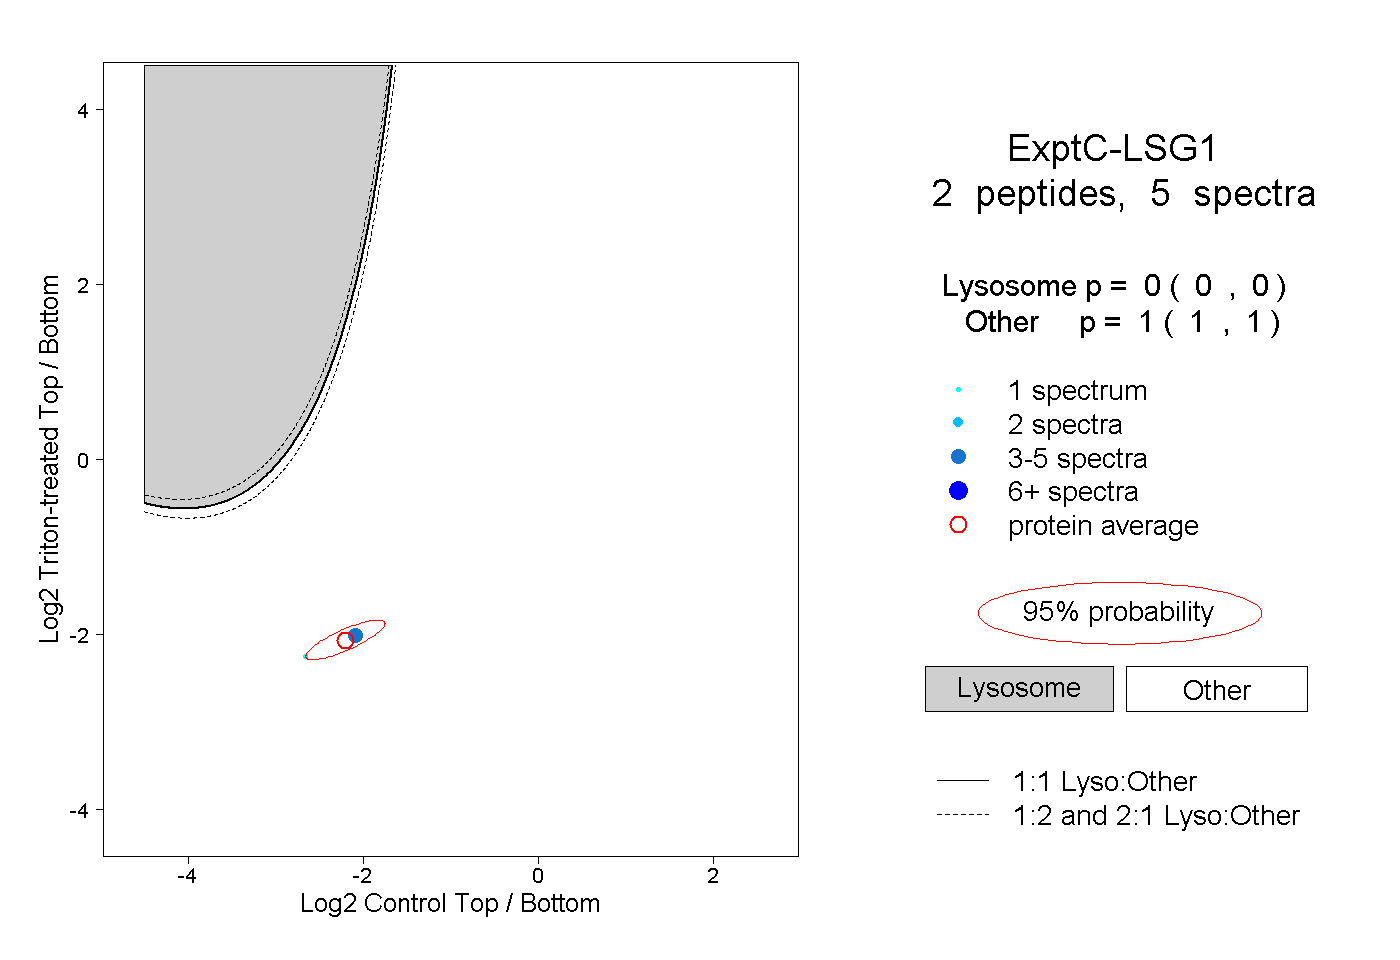
0.000 | 0.000
1.000 | 1.000
1peptide
spectra
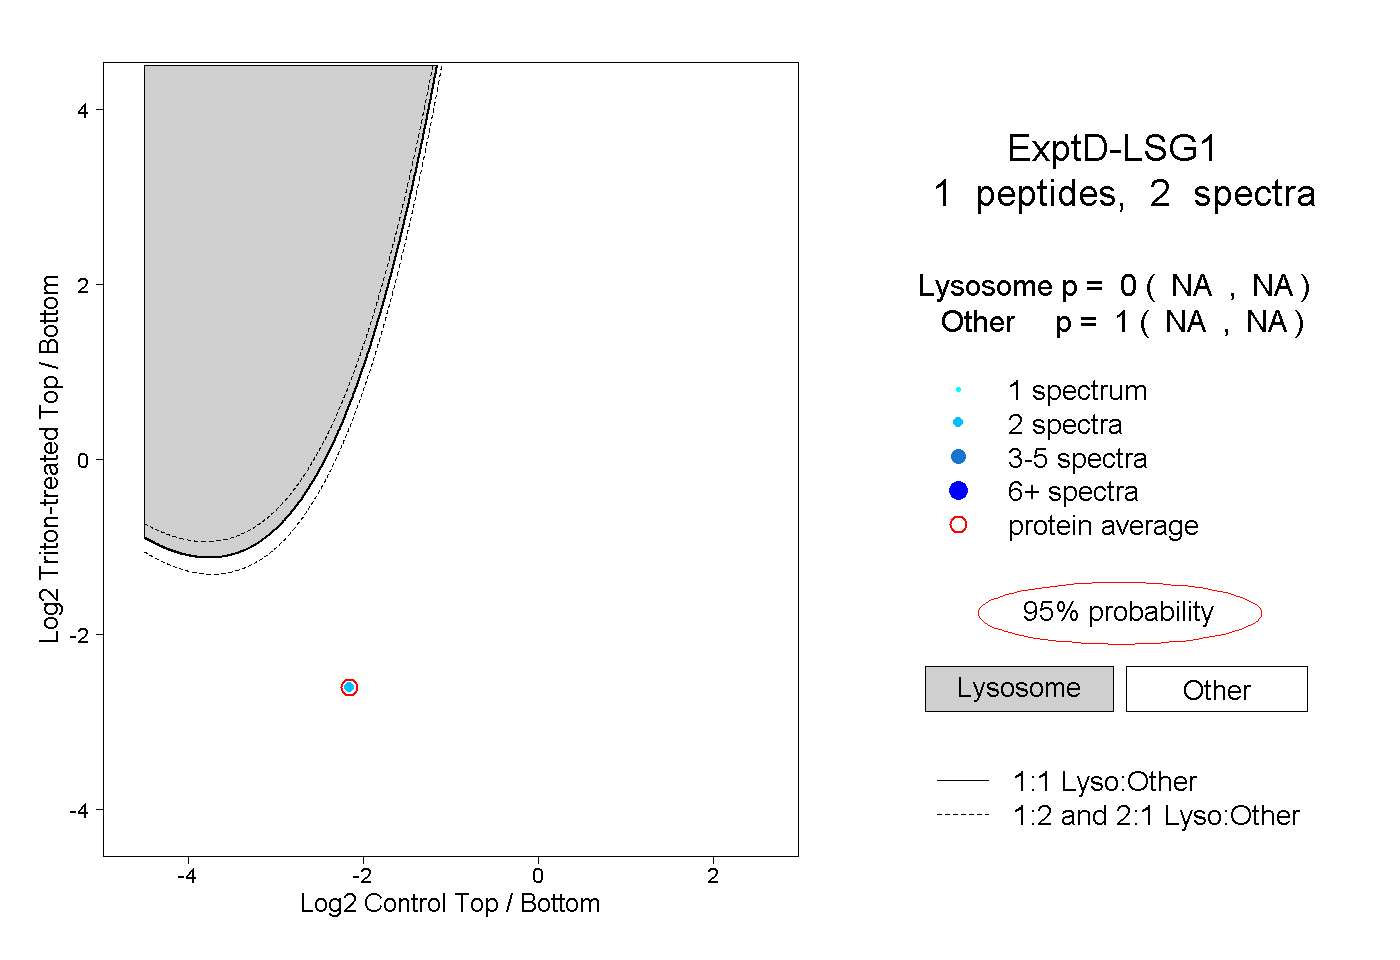
NA | NA
NA | NA