 7
7peptides
spectra
0.027 | 0.101
0.000 | 0.000
0.000 | 0.004
0.273 | 0.398
0.166 | 0.302
0.000 | 0.000
0.313 | 0.359
0.000 | 0.028
| Plot | Mito | Lyso | Perox | ER | Golgi | PM | Cytosol | Nucleus | |||||
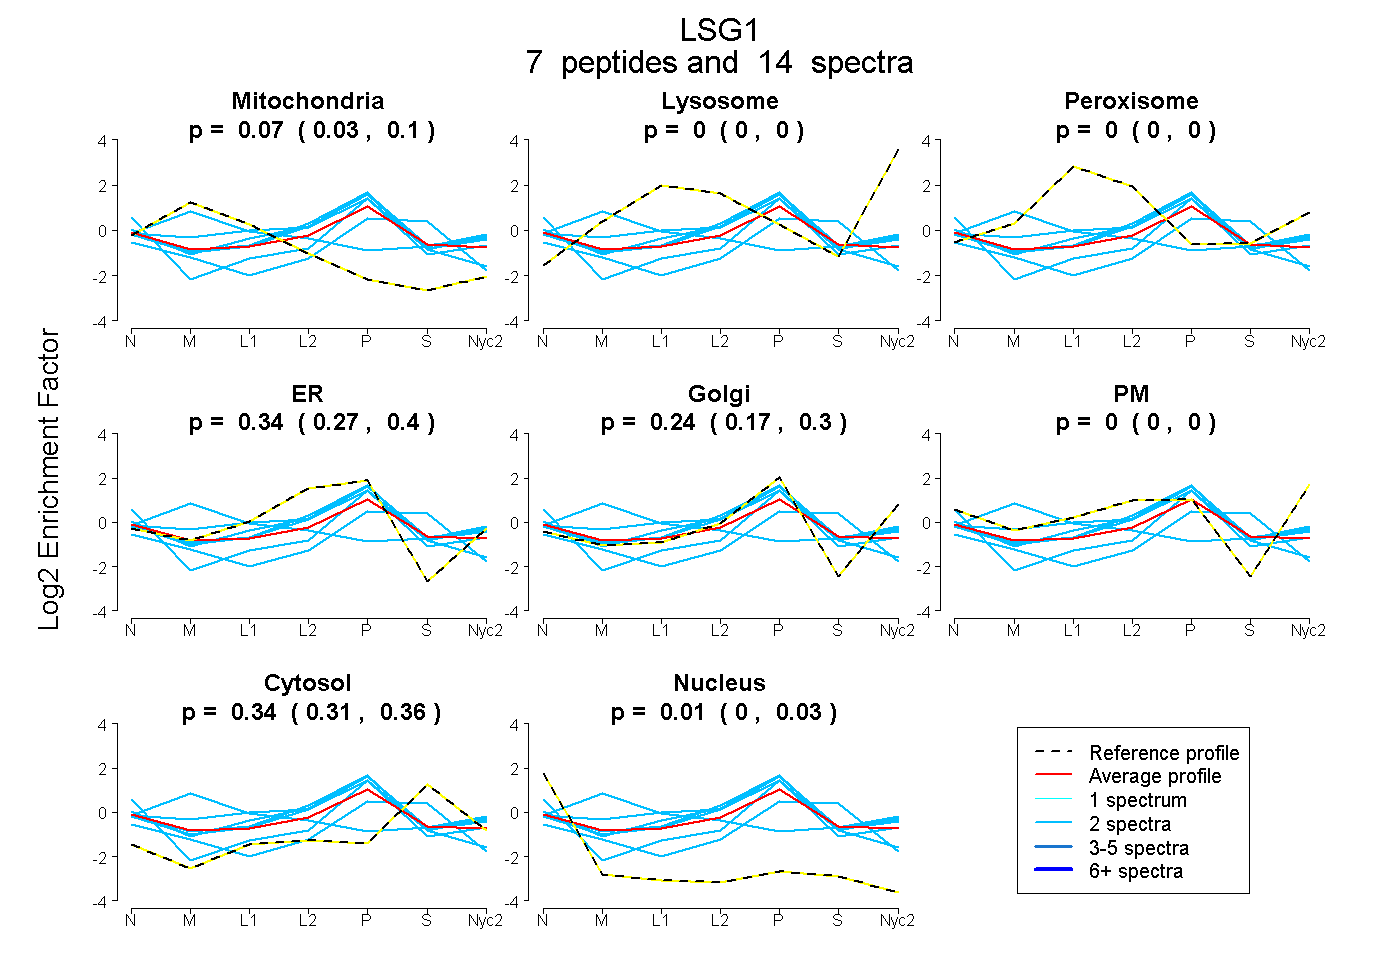
| Expt A |
7 peptides |
14 spectra |
|
0.070 0.027 | 0.101 |
0.000 0.000 | 0.000 |
0.000 0.000 | 0.004 |
0.341 0.273 | 0.398 |
0.241 0.166 | 0.302 |
0.000 0.000 | 0.000 |
0.339 0.313 | 0.359 |
0.009 0.000 | 0.028 |
| 2 spectra, VAWAVHFEK | 0.103 | 0.000 | 0.084 | 0.419 | 0.222 | 0.000 | 0.171 | 0.000 | ||
| 2 spectra, APGGGSLGR | 0.000 | 0.000 | 0.000 | 0.292 | 0.240 | 0.000 | 0.256 | 0.213 | ||
| 2 spectra, NLDFWR | 0.000 | 0.000 | 0.009 | 0.429 | 0.306 | 0.000 | 0.256 | 0.000 | ||
| 2 spectra, NPLFIR | 0.437 | 0.151 | 0.046 | 0.000 | 0.000 | 0.142 | 0.224 | 0.000 | ||
| 2 spectra, FVPPEAR | 0.000 | 0.000 | 0.000 | 0.091 | 0.205 | 0.000 | 0.581 | 0.123 | ||
| 2 spectra, ADLLTAEQR | 0.000 | 0.000 | 0.025 | 0.451 | 0.251 | 0.000 | 0.272 | 0.000 | ||
| 2 spectra, QFLCIPR | 0.000 | 0.000 | 0.000 | 0.390 | 0.319 | 0.000 | 0.291 | 0.000 |
| Plot | Mito | Lyso or Perox | ER | Golgi | PM | Cytosol | Nucleus | ||||||
| Expt B |
1 peptide |
1 spectrum |
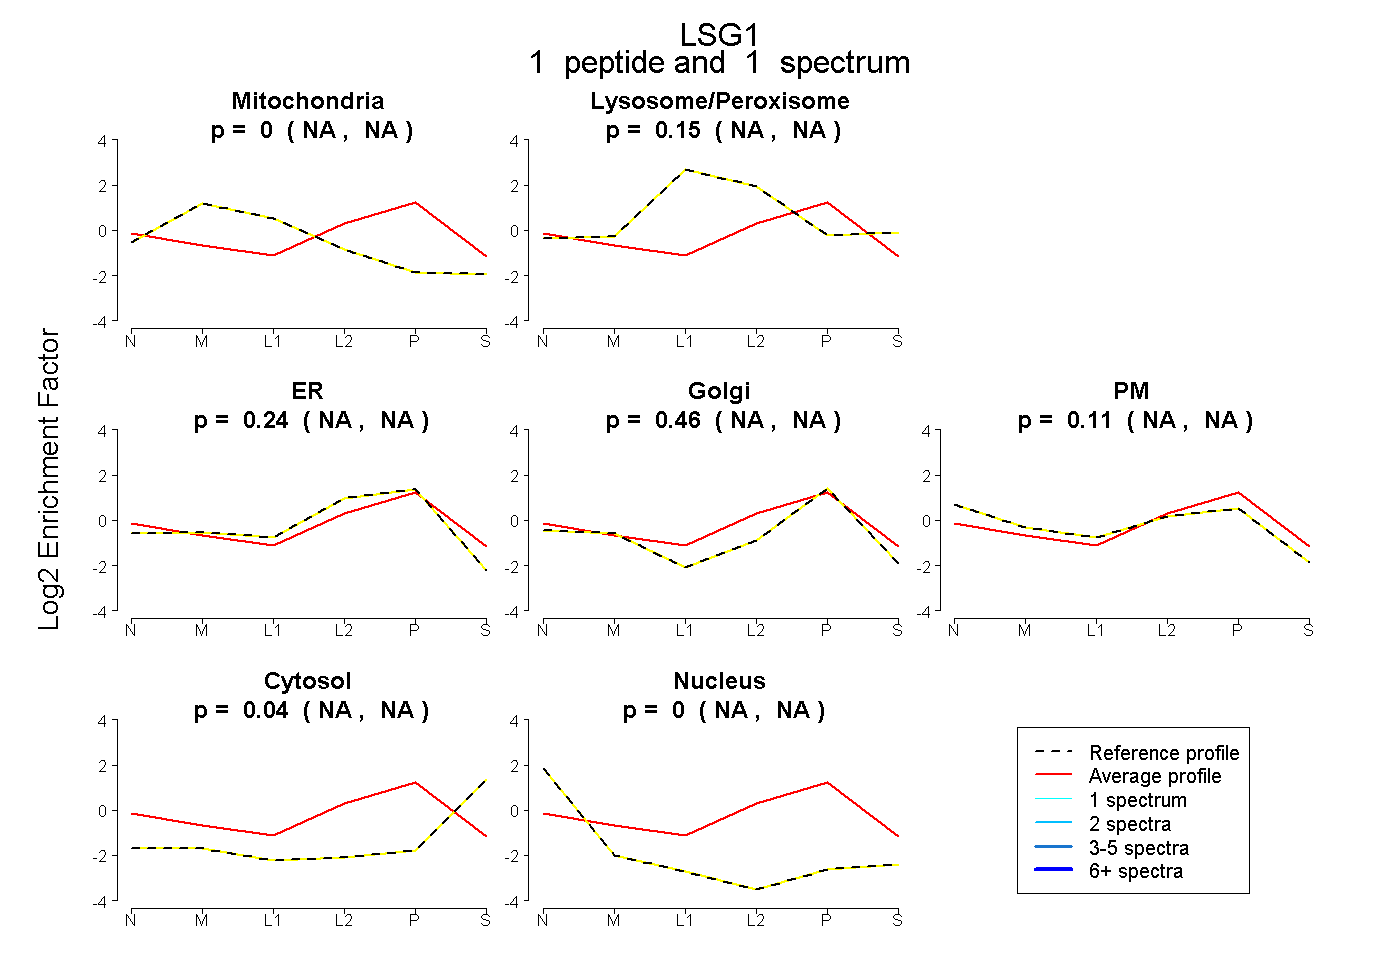 |
0.000 NA | NA |
0.148 NA | NA |
0.240 NA | NA |
0.461 NA | NA |
0.113 NA | NA |
0.039 NA | NA |
0.000 NA | NA |
|||
| Plot | Lyso | Other | |||||||||||
| Expt C |
2 peptides |
5 spectra |
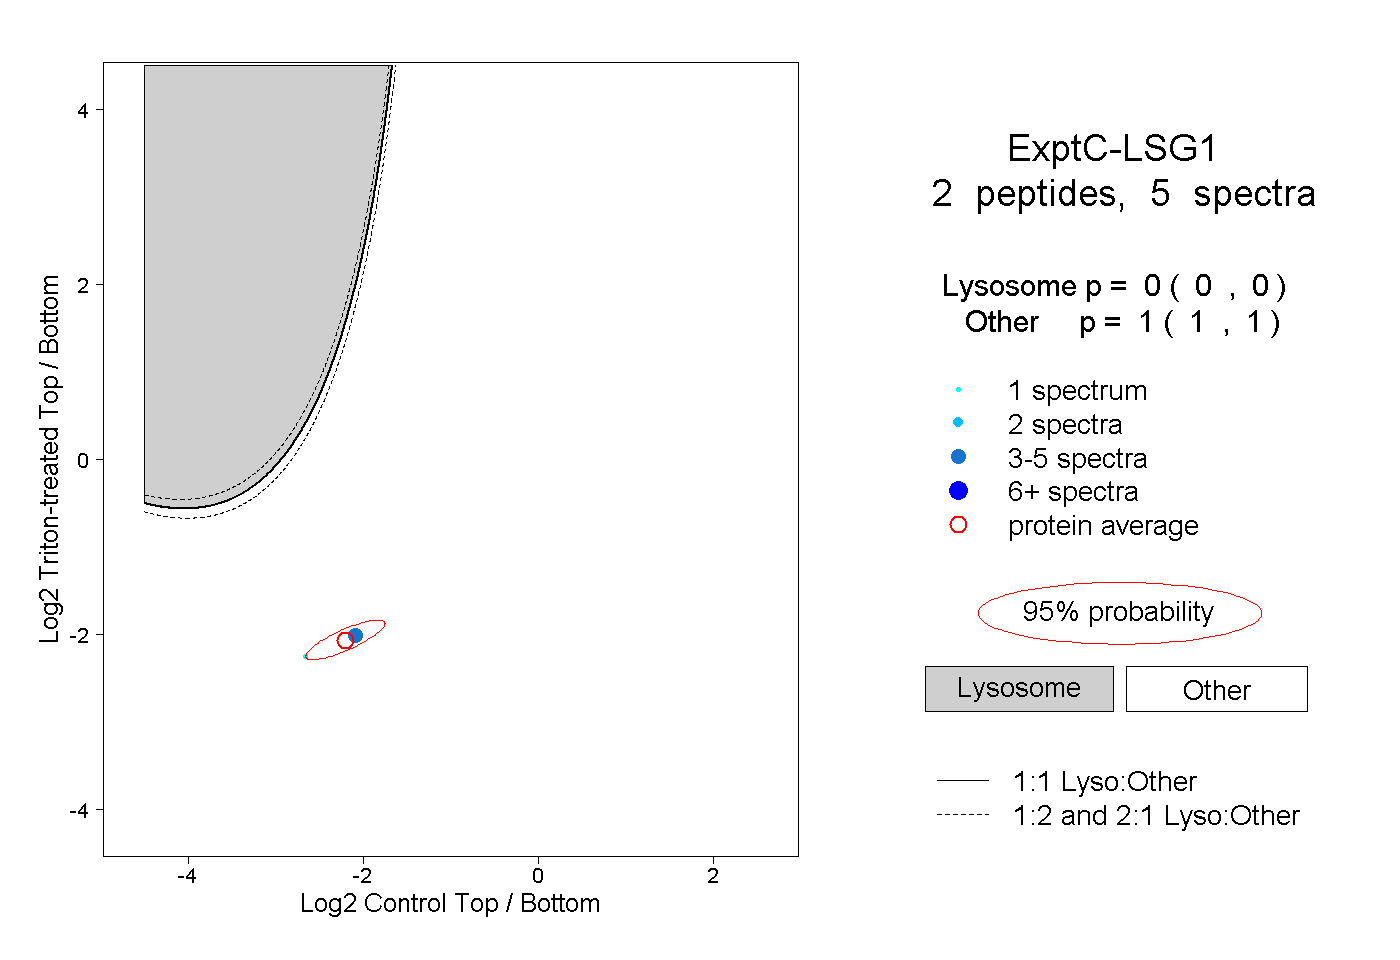 |
0.000 0.000 | 0.000 |
1.000 1.000 | 1.000 |
||||||||
| Plot | Lyso | Other | |||||||||||
| Expt D |
1 peptide |
2 spectra |
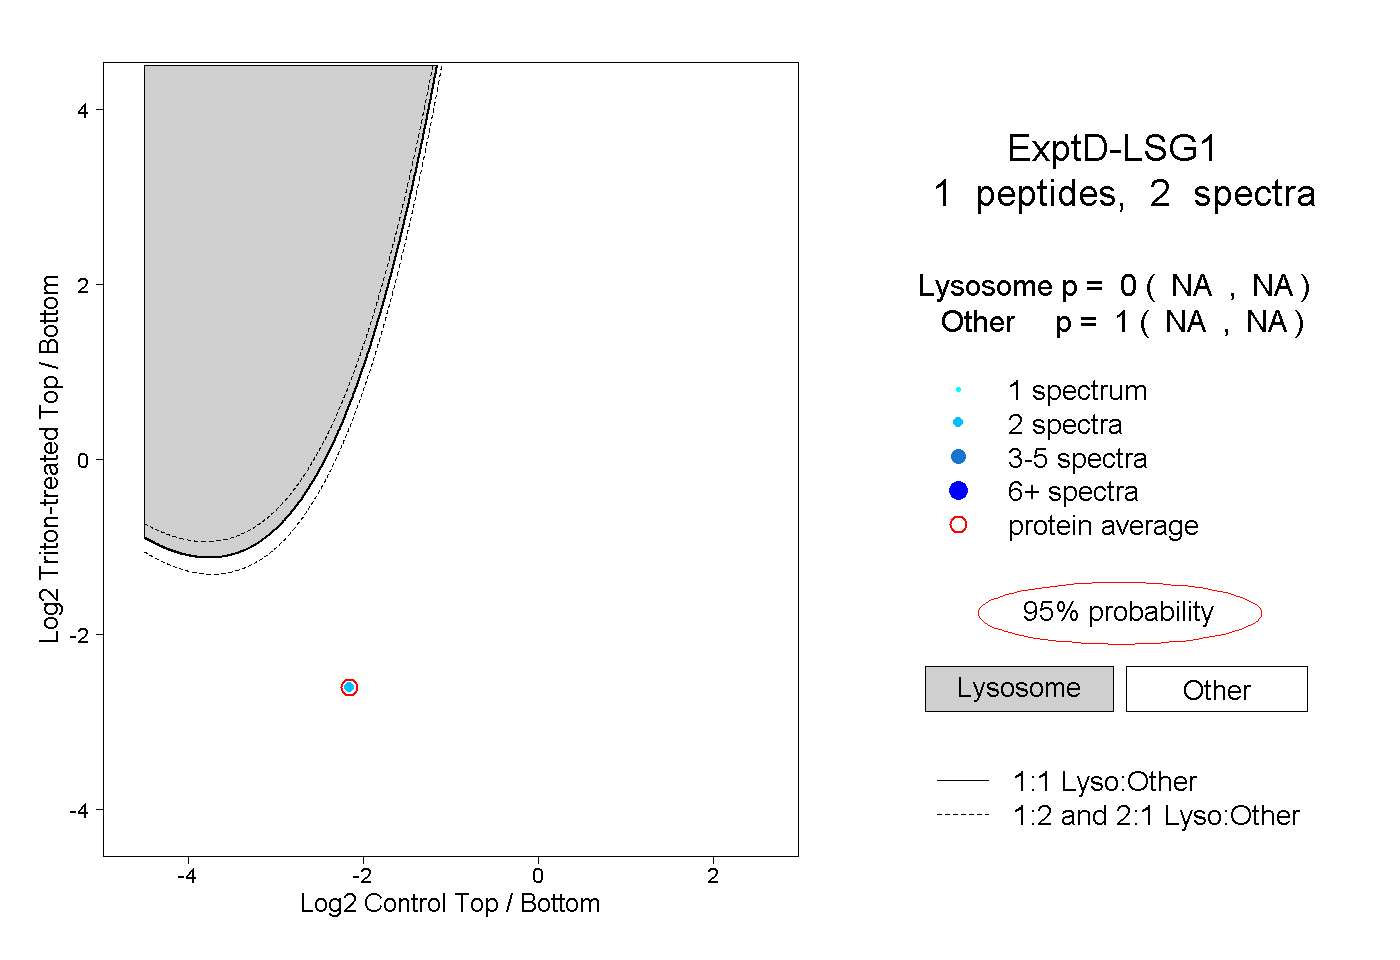 |
0.000 NA | NA |
1.000 NA | NA |