 5
5peptides
spectra
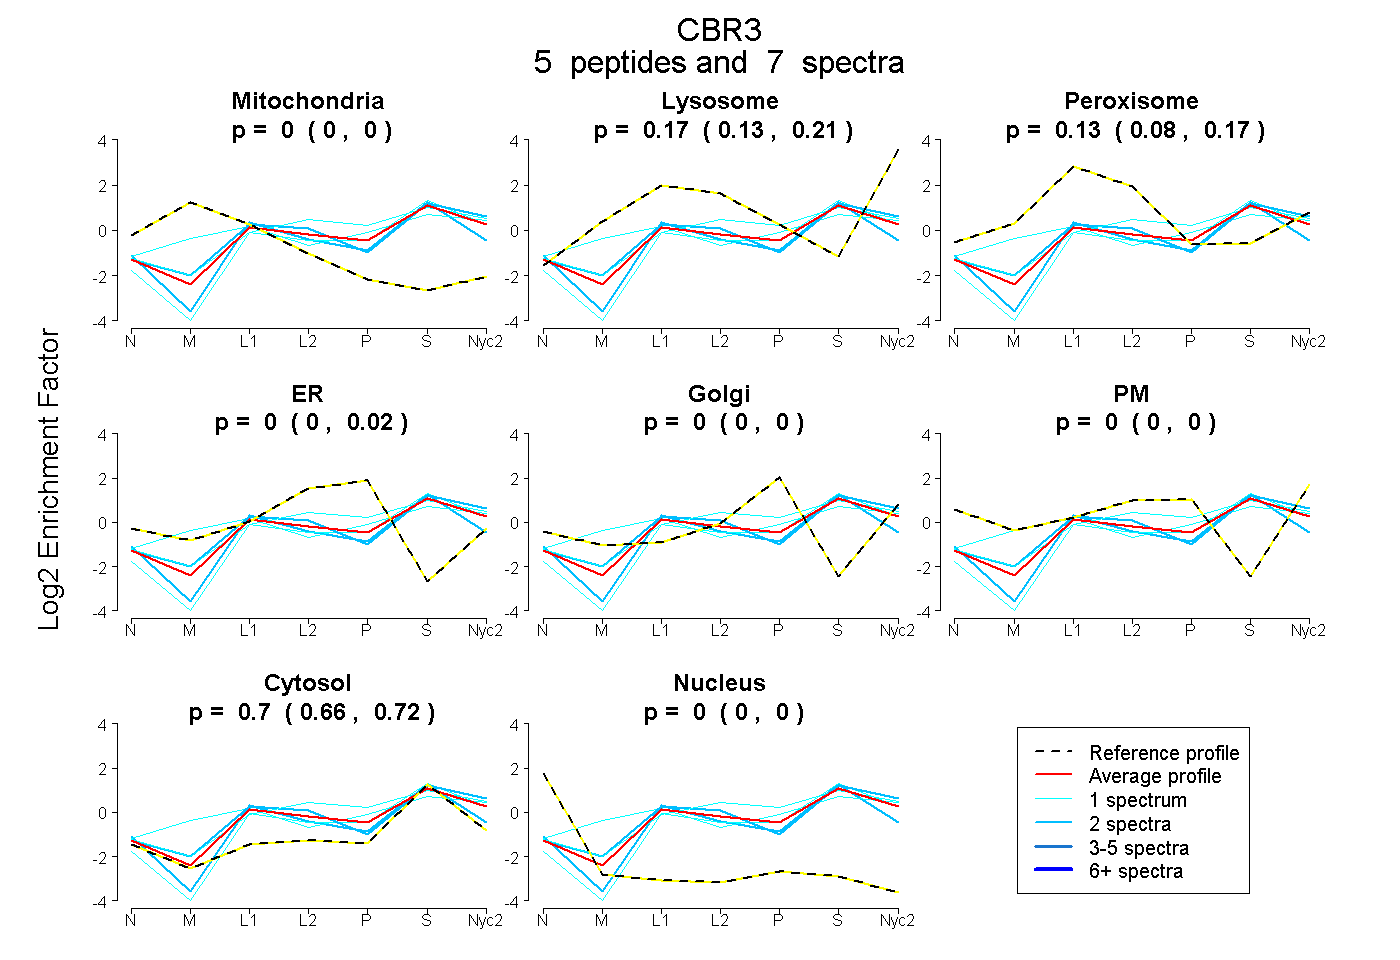
0.000 | 0.000
0.126 | 0.208
0.076 | 0.170
0.000 | 0.017
0.000 | 0.000
0.000 | 0.000
0.663 | 0.724
0.000 | 0.000
2peptides
spectra
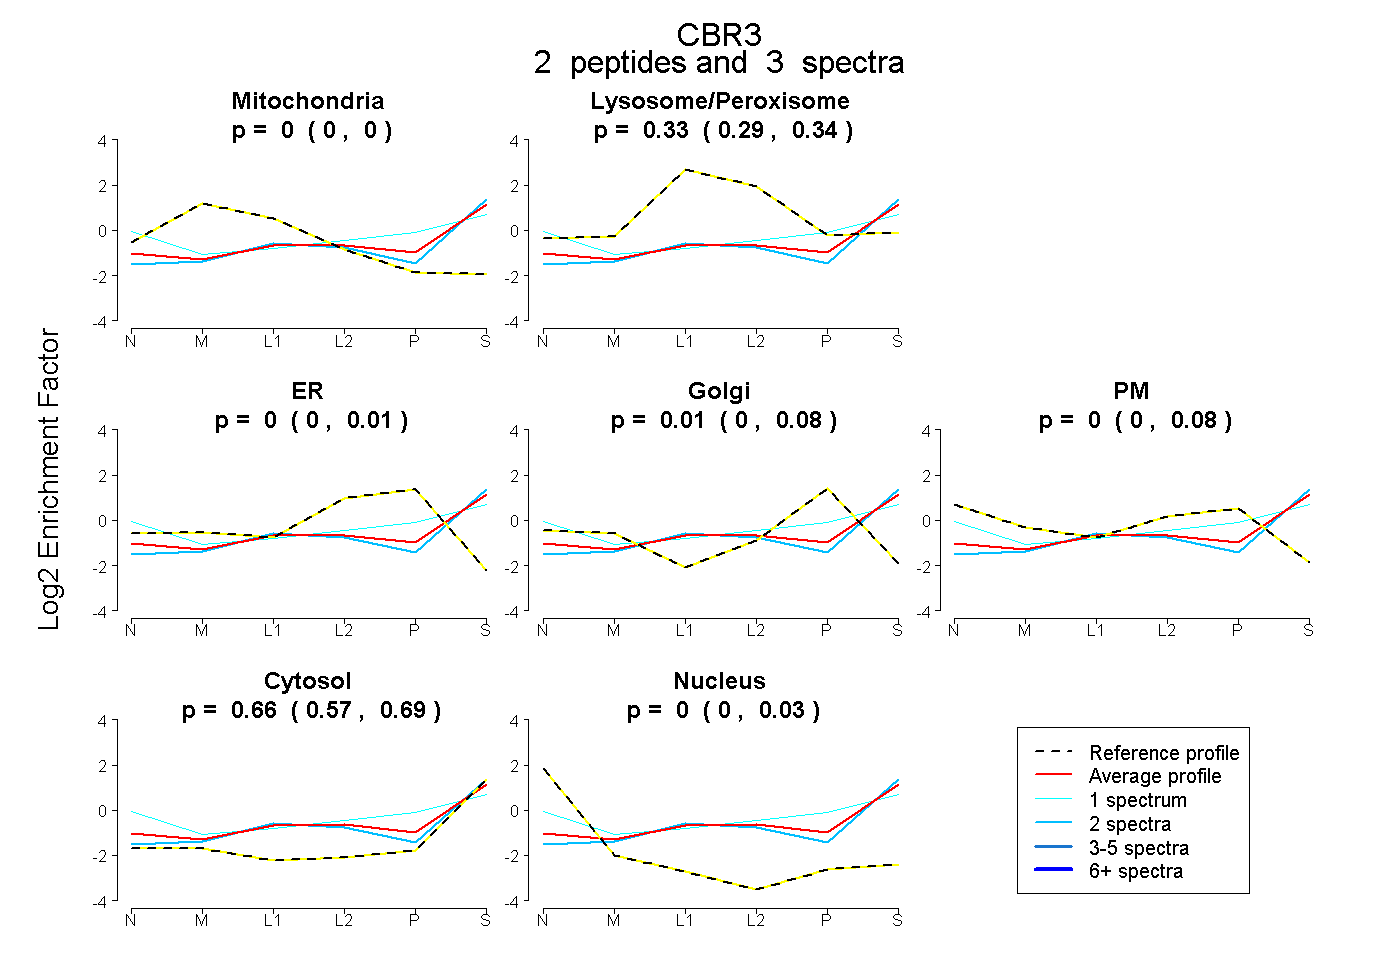
0.000 | 0.000
0.295 | 0.341
0.000 | 0.014
0.000 | 0.077
0.000 | 0.075
0.575 | 0.685
0.000 | 0.031
6peptides
spectra
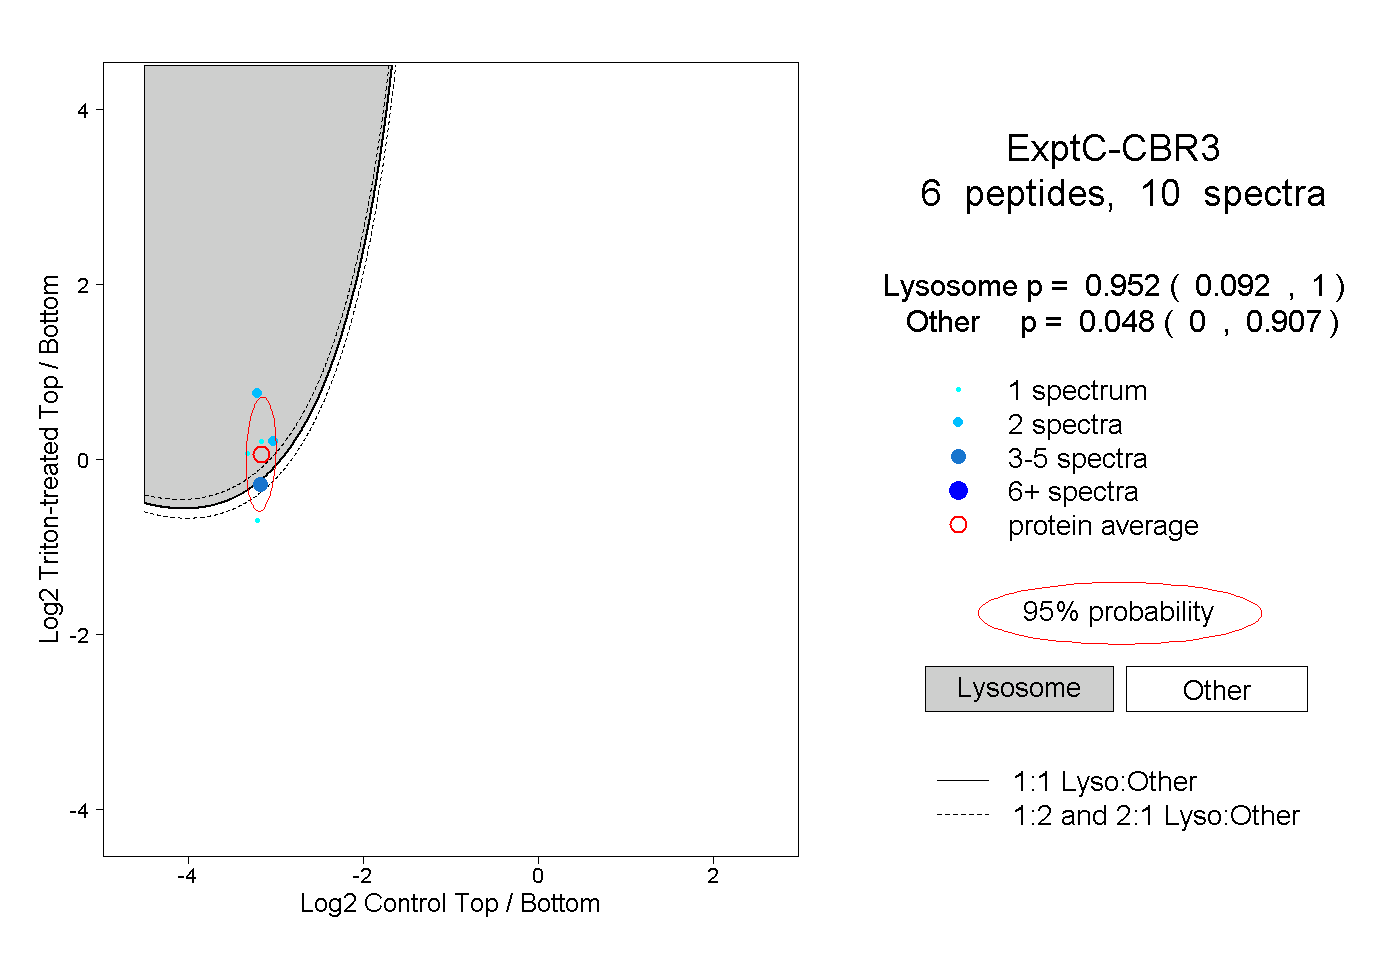
0.092 | 1.000
0.000 | 0.907