 5
5peptides
spectra
0.000 | 0.000
0.126 | 0.208
0.076 | 0.170
0.000 | 0.017
0.000 | 0.000
0.000 | 0.000
0.663 | 0.724
0.000 | 0.000
| Plot | Mito | Lyso | Perox | ER | Golgi | PM | Cytosol | Nucleus | |||||
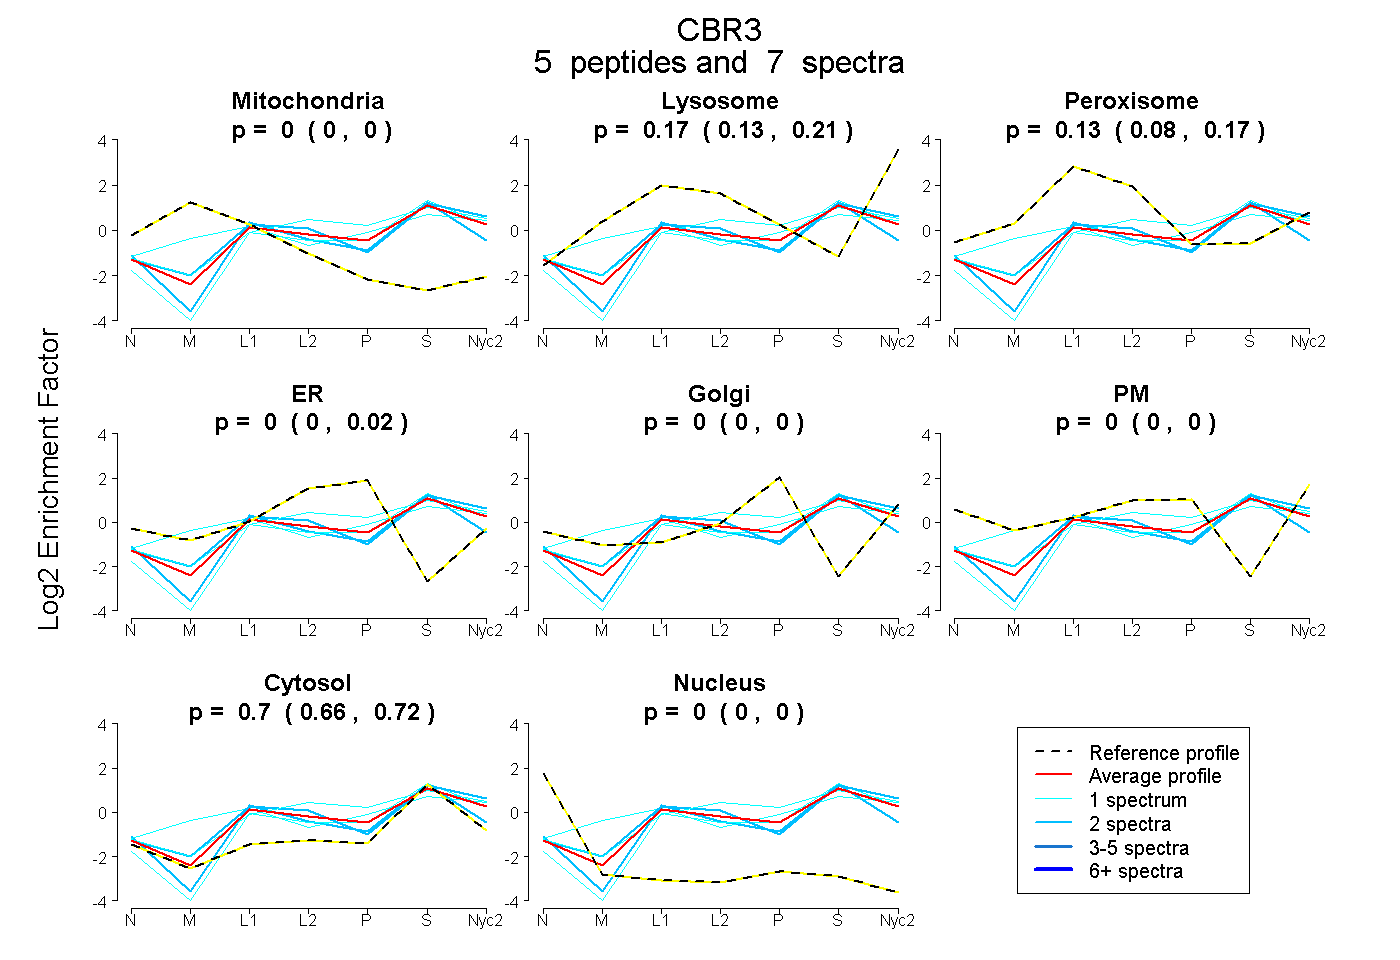
| Expt A |
5 peptides |
7 spectra |
|
0.000 0.000 | 0.000 |
0.173 0.126 | 0.208 |
0.131 0.076 | 0.170 |
0.000 0.000 | 0.017 |
0.000 0.000 | 0.000 |
0.000 0.000 | 0.000 |
0.697 0.663 | 0.724 |
0.000 0.000 | 0.000 |
| 2 spectra, TNFFATR | 0.000 | 0.201 | 0.160 | 0.000 | 0.000 | 0.000 | 0.640 | 0.000 | ||
| 1 spectrum, LGVTVLTR | 0.000 | 0.159 | 0.000 | 0.000 | 0.000 | 0.000 | 0.841 | 0.000 | ||
| 1 spectrum, VVNVSSLQGLK | 0.000 | 0.260 | 0.037 | 0.116 | 0.000 | 0.000 | 0.587 | 0.000 | ||
| 1 spectrum, NVCTELLPIMKPHGR | 0.055 | 0.259 | 0.116 | 0.000 | 0.056 | 0.000 | 0.514 | 0.000 | ||
| 2 spectra, ALENCSEDLQER | 0.000 | 0.000 | 0.199 | 0.000 | 0.000 | 0.000 | 0.801 | 0.000 |
| Plot | Mito | Lyso or Perox | ER | Golgi | PM | Cytosol | Nucleus | ||||||
| Expt B |
2 peptides |
3 spectra |
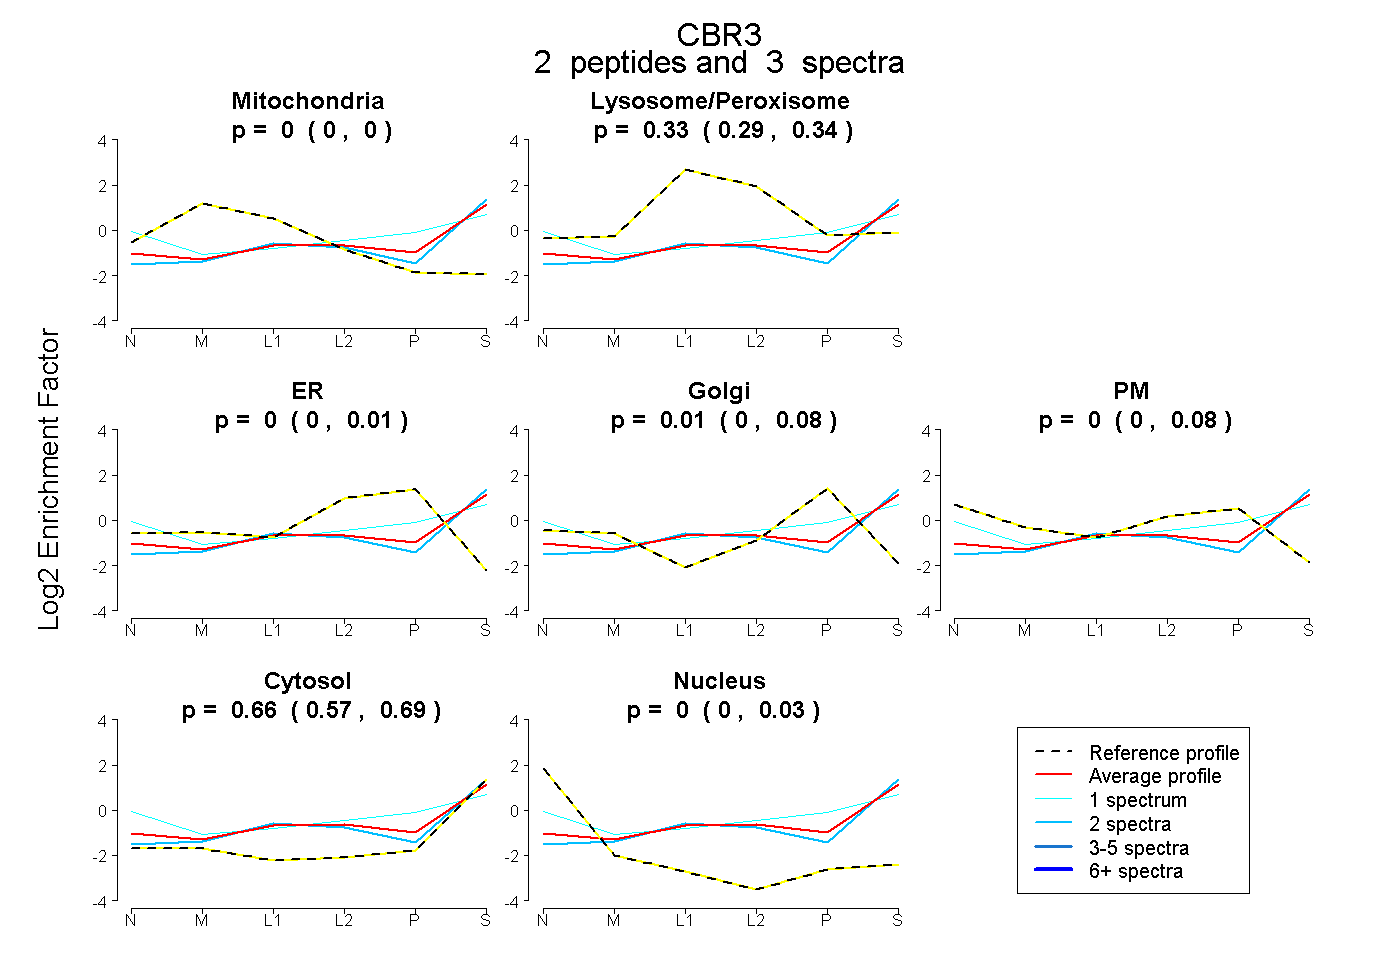 |
0.000 0.000 | 0.000 |
0.332 0.295 | 0.341 |
0.000 0.000 | 0.014 |
0.006 0.000 | 0.077 |
0.005 0.000 | 0.075 |
0.657 0.575 | 0.685 |
0.000 0.000 | 0.031 |
|||
| Plot | Lyso | Other | |||||||||||
| Expt C |
6 peptides |
10 spectra |
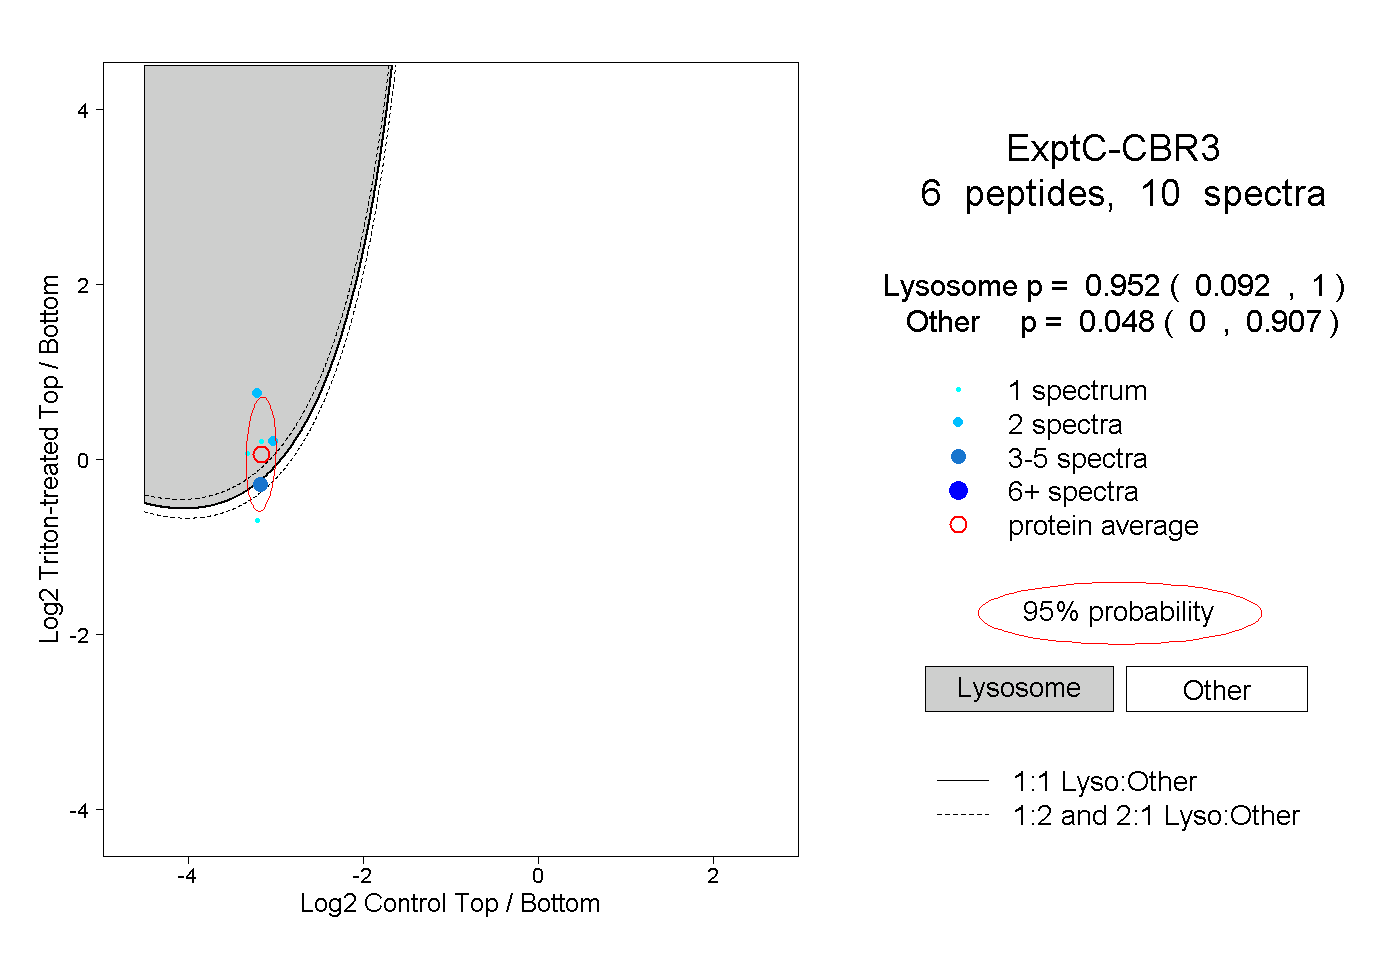 |
0.952 0.092 | 1.000 |
0.048 0.000 | 0.907 |