 4
4peptides
spectra
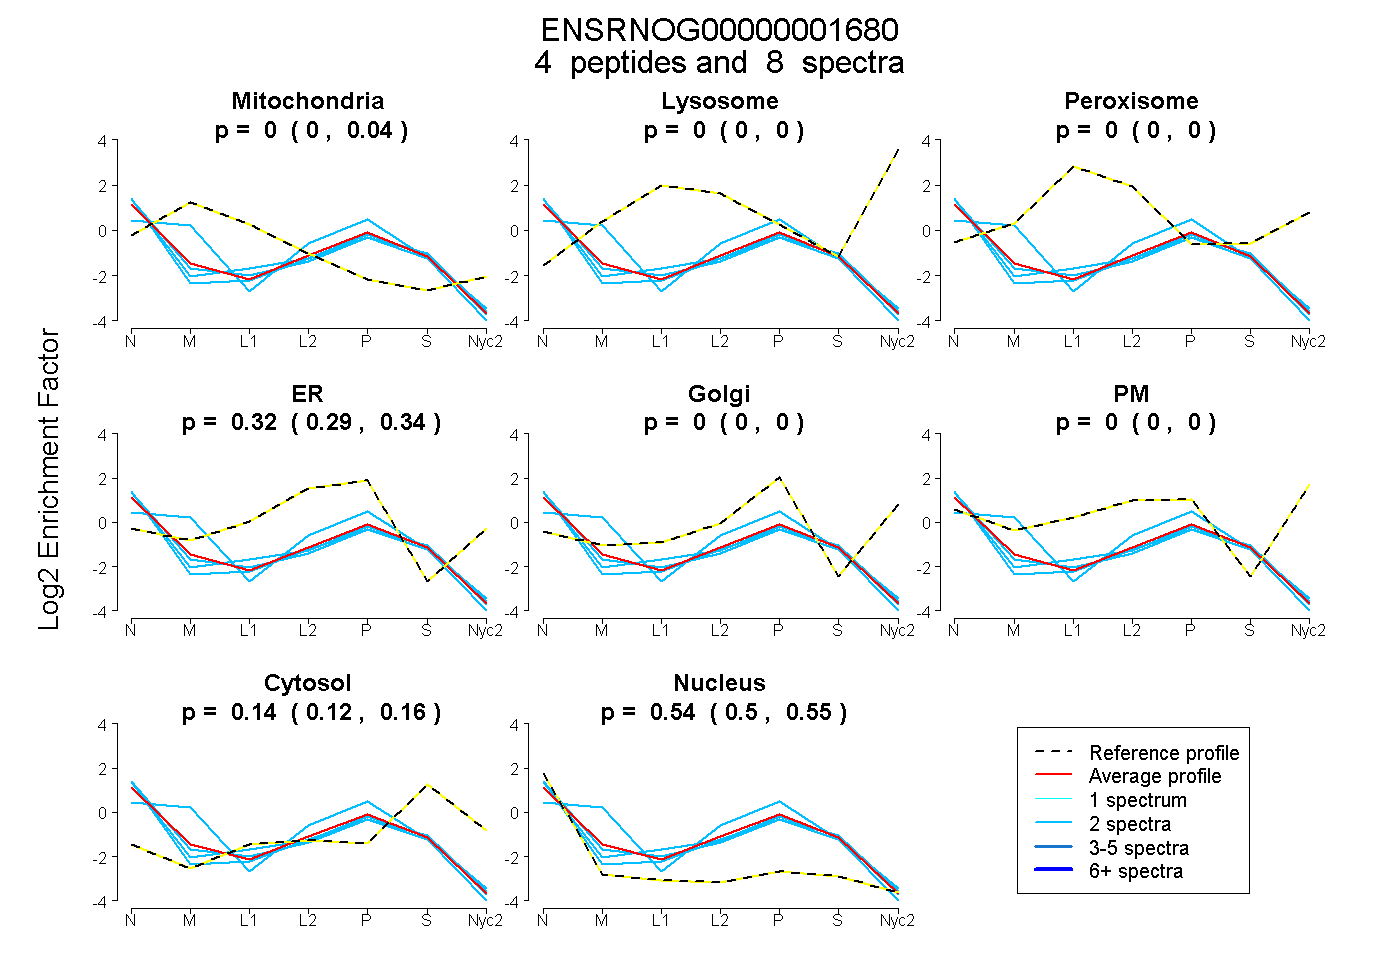
0.000 | 0.042
0.000 | 0.000
0.000 | 0.000
0.293 | 0.335
0.000 | 0.000
0.000 | 0.000
0.117 | 0.158
0.504 | 0.554
3peptides
spectra
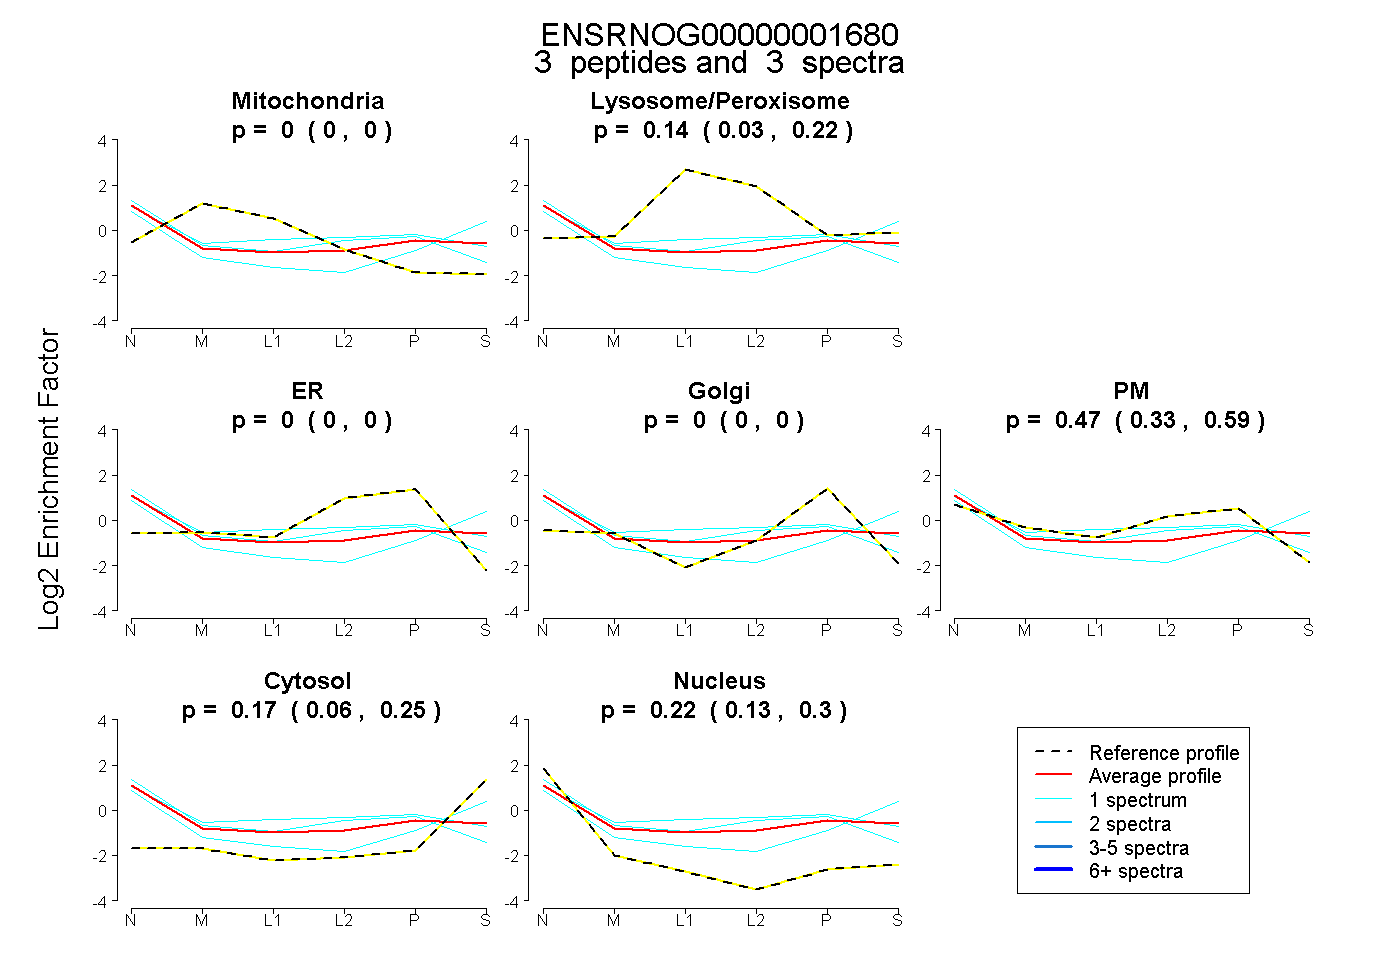
0.000 | 0.000
0.031 | 0.224
0.000 | 0.000
0.000 | 0.000
0.328 | 0.591
0.064 | 0.250
0.132 | 0.304