 4
4peptides
spectra
0.000 | 0.042
0.000 | 0.000
0.000 | 0.000
0.293 | 0.335
0.000 | 0.000
0.000 | 0.000
0.117 | 0.158
0.504 | 0.554
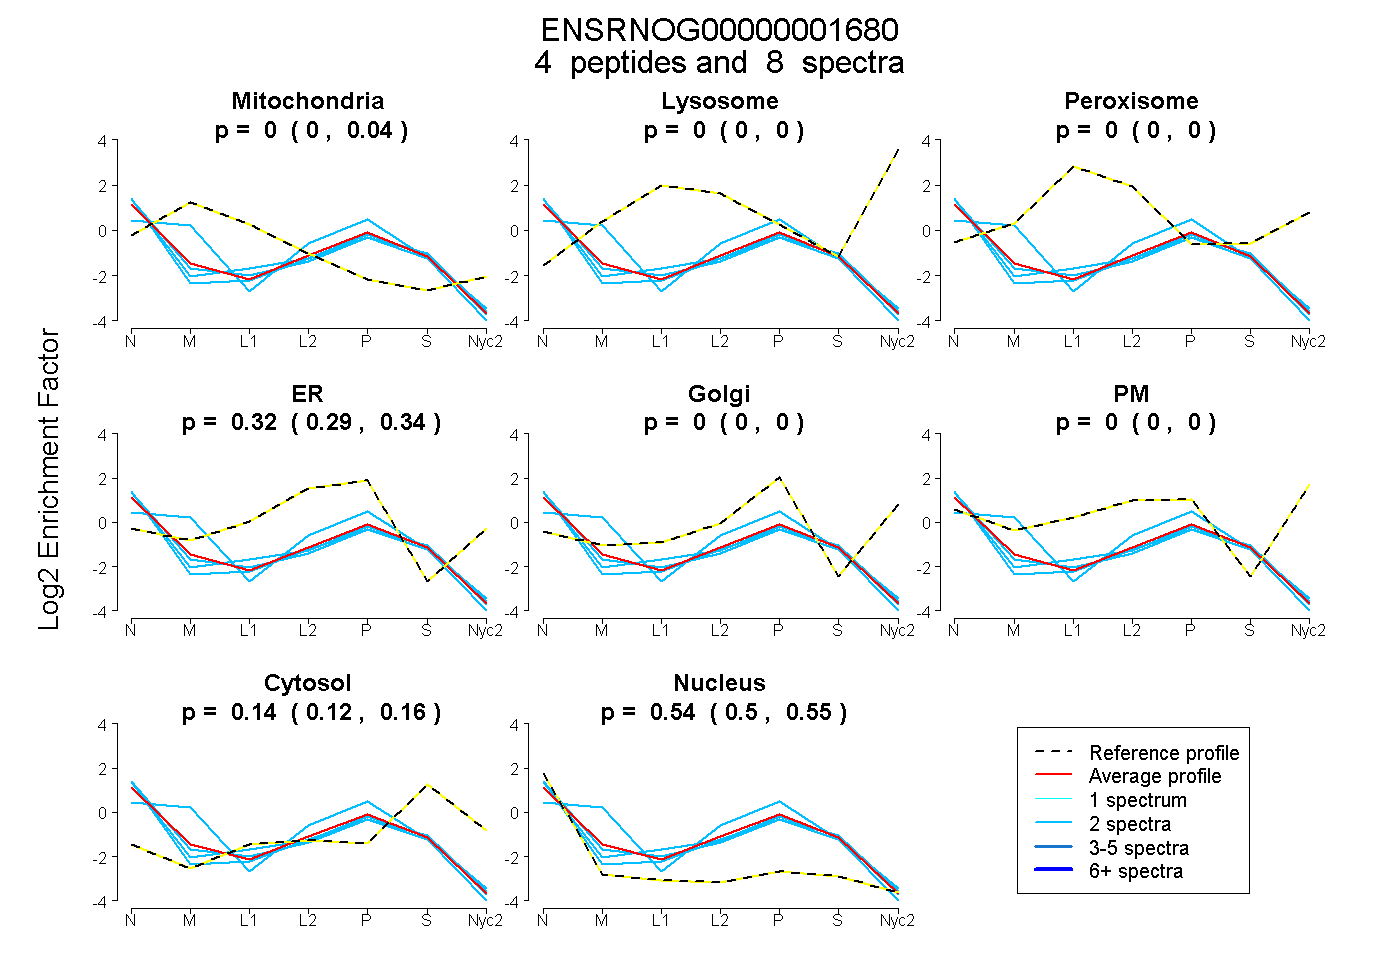
| Plot | Mito | Lyso | Perox | ER | Golgi | PM | Cytosol | Nucleus | |||||
| Expt A |
4 peptides |
8 spectra |
|
0.000 0.000 | 0.042 |
0.000 0.000 | 0.000 |
0.000 0.000 | 0.000 |
0.321 0.293 | 0.335 |
0.000 0.000 | 0.000 |
0.000 0.000 | 0.000 |
0.141 0.117 | 0.158 |
0.538 0.504 | 0.554 |
| 2 spectra, LYSPTVPLAR | 0.000 | 0.000 | 0.000 | 0.291 | 0.000 | 0.000 | 0.142 | 0.567 | ||
| 2 spectra, EVETEIYGLR | 0.000 | 0.000 | 0.000 | 0.295 | 0.000 | 0.000 | 0.157 | 0.548 | ||
| 2 spectra, ATIQFHQPQR | 0.179 | 0.000 | 0.000 | 0.358 | 0.000 | 0.000 | 0.067 | 0.396 | ||
| 2 spectra, EYSVEPEDR | 0.000 | 0.000 | 0.000 | 0.247 | 0.000 | 0.000 | 0.183 | 0.570 |
| Plot | Mito | Lyso or Perox | ER | Golgi | PM | Cytosol | Nucleus | ||||||
| Expt B |
3 peptides |
3 spectra |
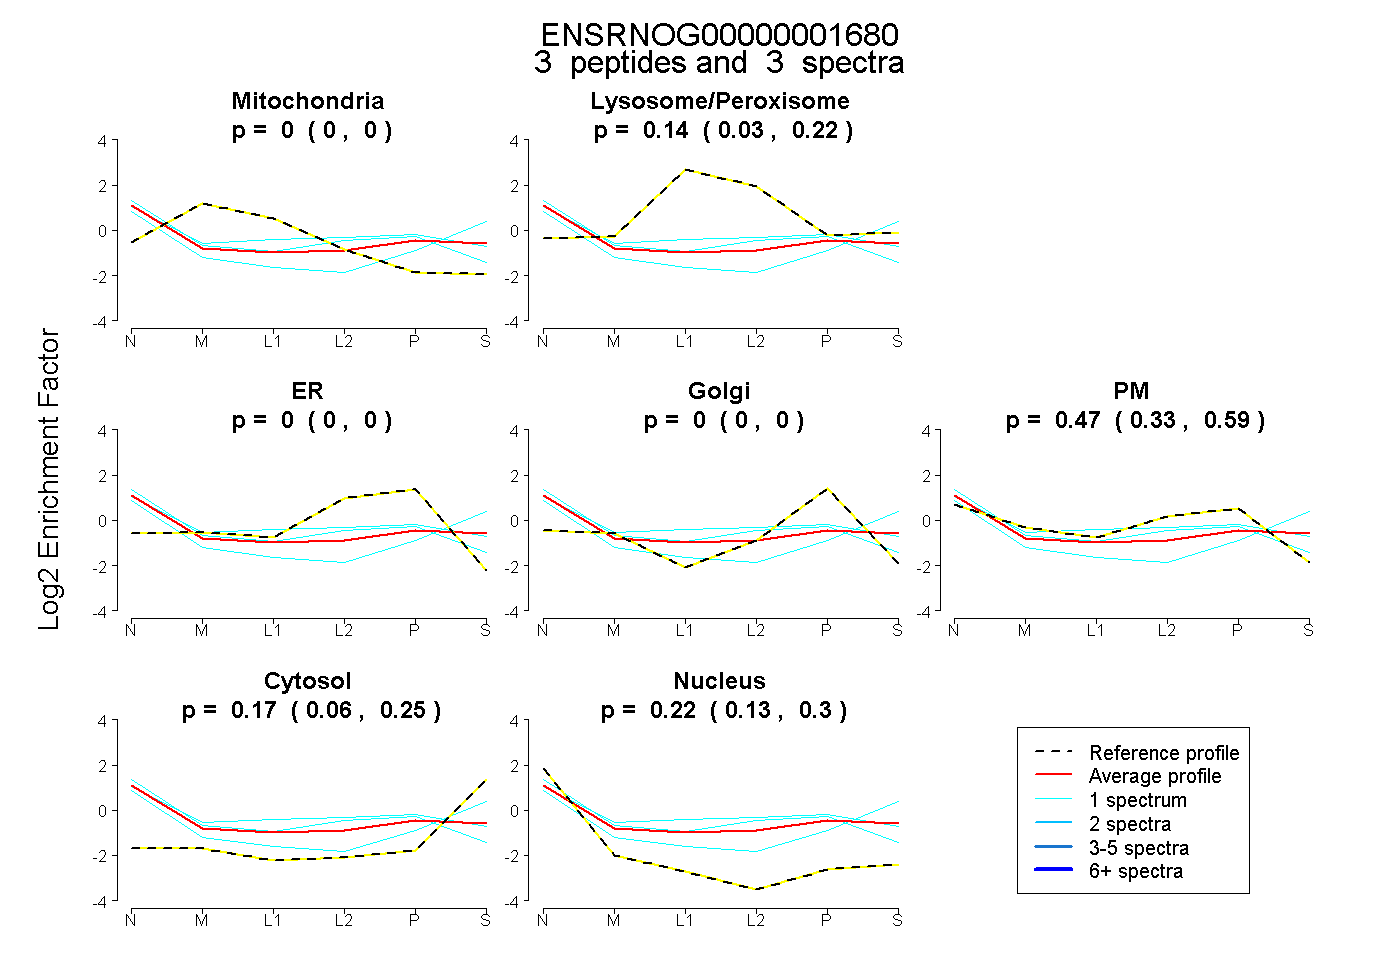 |
0.000 0.000 | 0.000 |
0.138 0.031 | 0.224 |
0.000 0.000 | 0.000 |
0.000 0.000 | 0.000 |
0.470 0.328 | 0.591 |
0.169 0.064 | 0.250 |
0.223 0.132 | 0.304 |