 5
5peptides
spectra
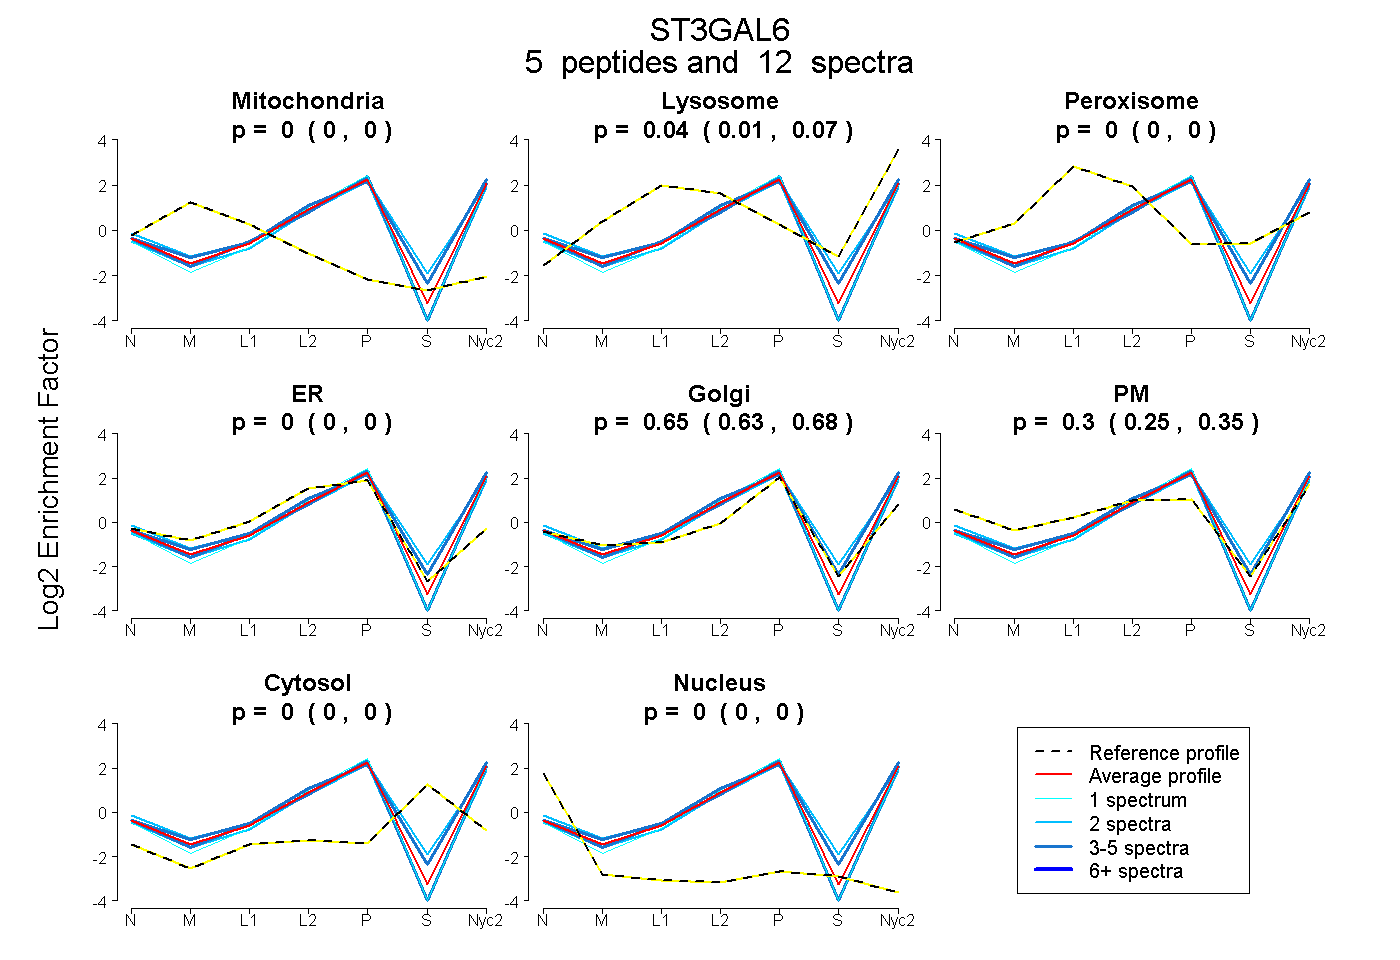
0.000 | 0.000
0.013 | 0.069
0.000 | 0.000
0.000 | 0.000
0.628 | 0.677
0.247 | 0.346
0.000 | 0.000
0.000 | 0.000
2peptides
spectra
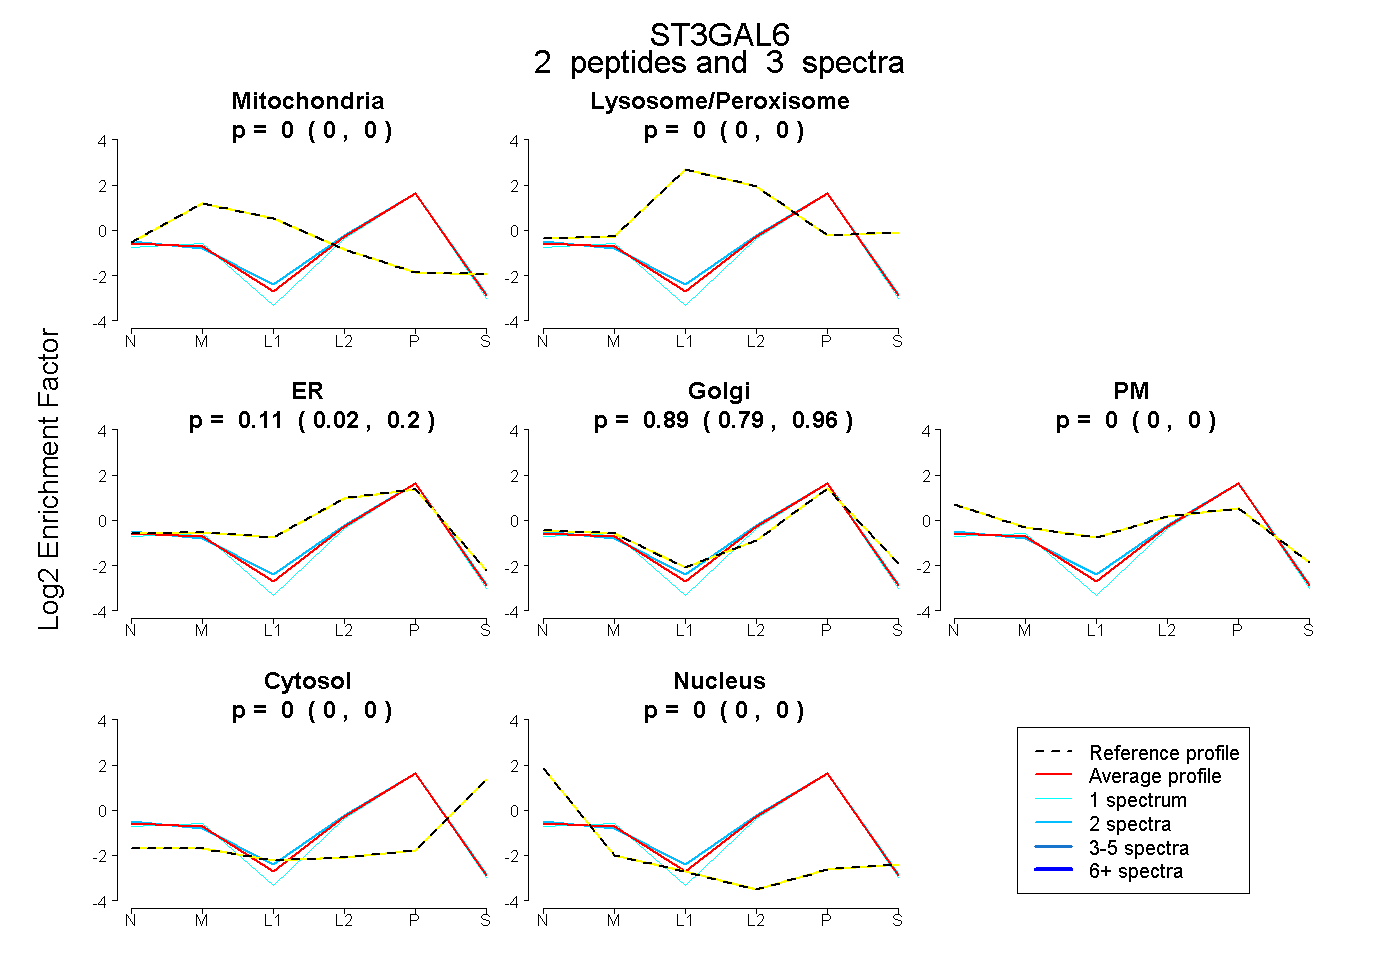
0.000 | 0.000
0.000 | 0.000
0.024 | 0.196
0.787 | 0.960
0.000 | 0.000
0.000 | 0.000
0.000 | 0.000
8peptides
spectra
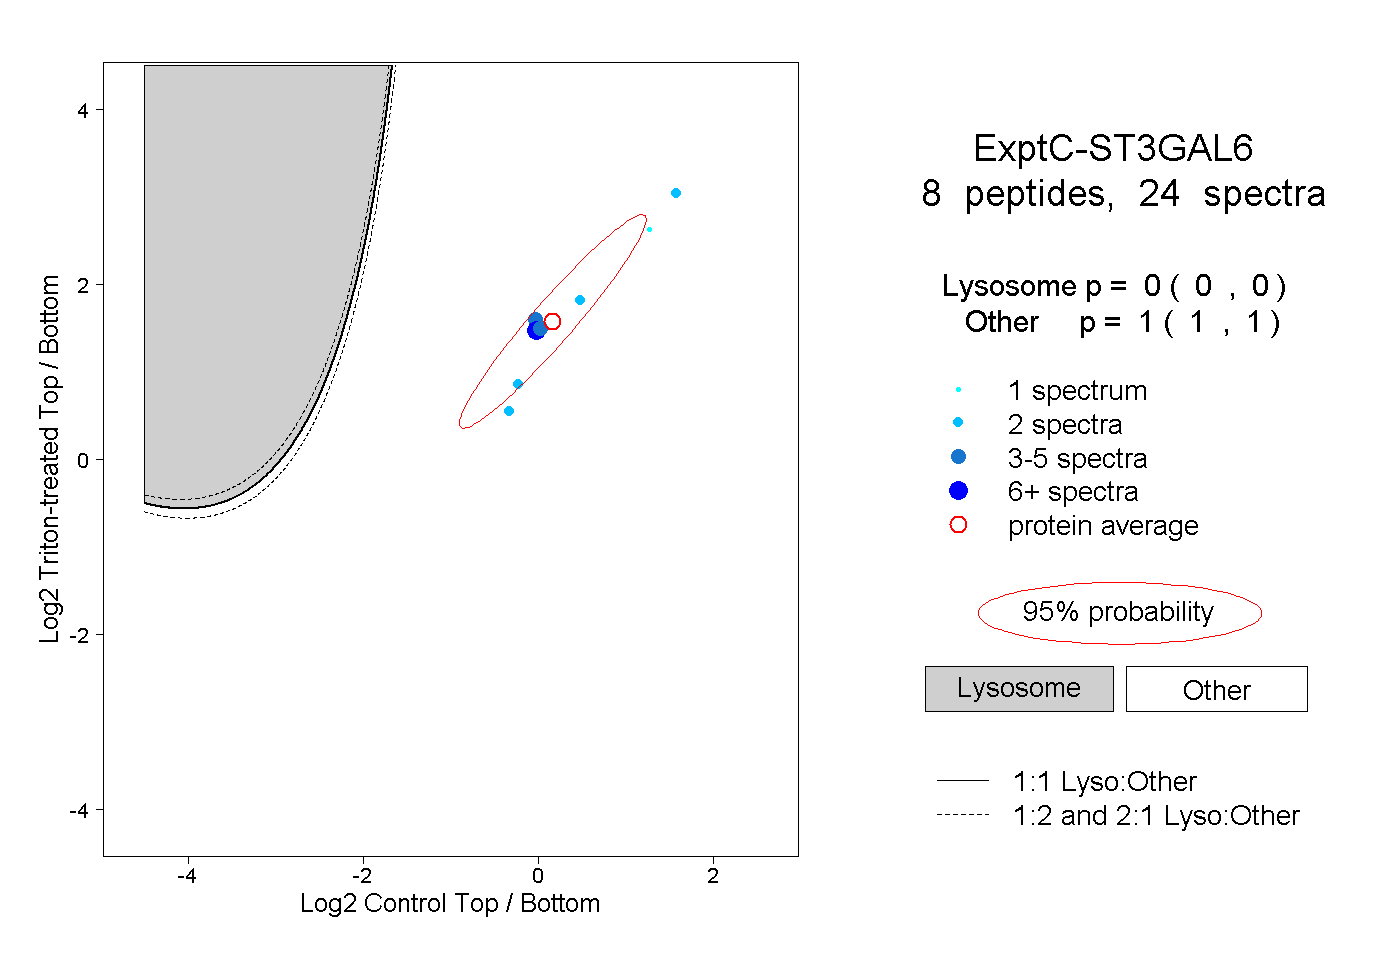
0.000 | 0.000
1.000 | 1.000
2peptides
spectra
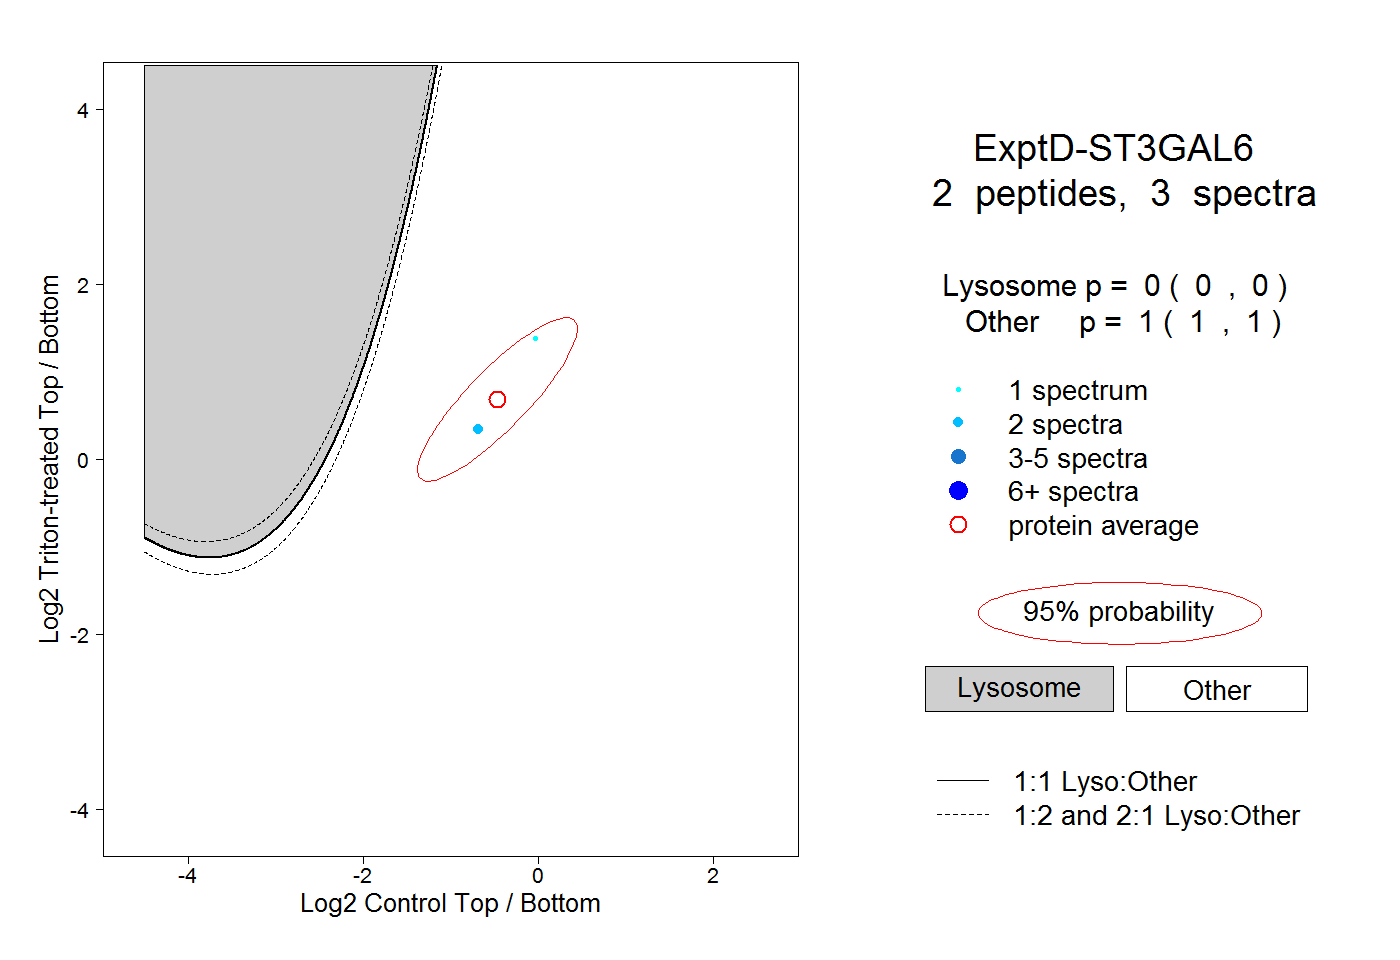
0.000 | 0.000
1.000 | 1.000