 5
5peptides
spectra
0.000 | 0.000
0.013 | 0.069
0.000 | 0.000
0.000 | 0.000
0.628 | 0.677
0.247 | 0.346
0.000 | 0.000
0.000 | 0.000
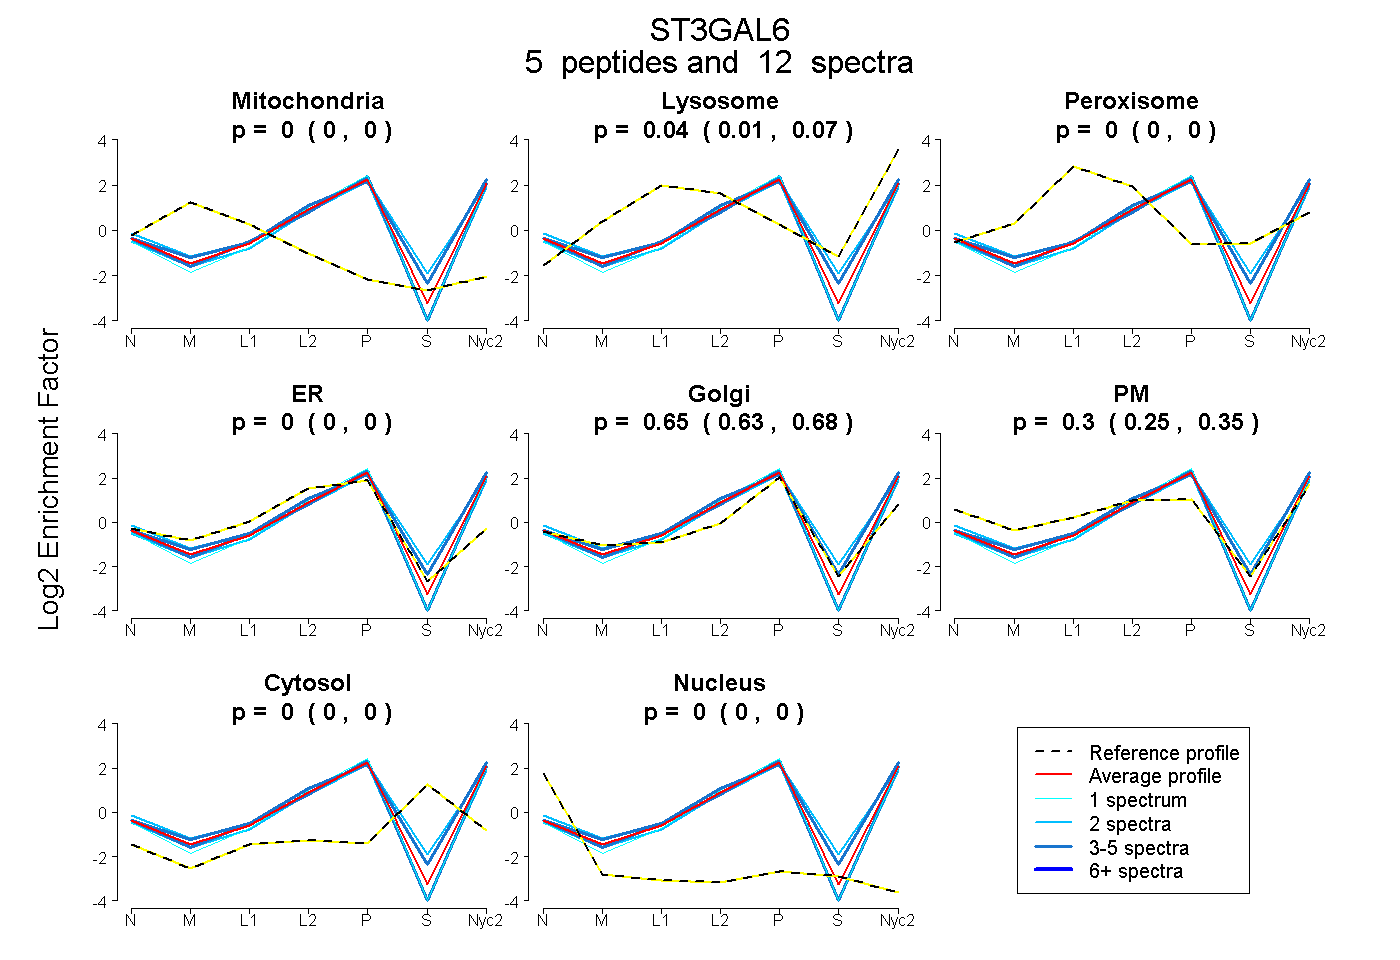
| Plot | Mito | Lyso | Perox | ER | Golgi | PM | Cytosol | Nucleus | |||||
| Expt A |
5 peptides |
12 spectra |
|
0.000 0.000 | 0.000 |
0.045 0.013 | 0.069 |
0.000 0.000 | 0.000 |
0.000 0.000 | 0.000 |
0.655 0.628 | 0.677 |
0.301 0.247 | 0.346 |
0.000 0.000 | 0.000 |
0.000 0.000 | 0.000 |
| 2 spectra, IDSYDVIIR | 0.000 | 0.178 | 0.000 | 0.000 | 0.822 | 0.000 | 0.000 | 0.000 | ||
| 3 spectra, ILDPYIIR | 0.000 | 0.000 | 0.000 | 0.000 | 0.658 | 0.342 | 0.000 | 0.000 | ||
| 1 spectrum, KPAFASLLR | 0.000 | 0.000 | 0.000 | 0.026 | 0.731 | 0.243 | 0.000 | 0.000 | ||
| 2 spectra, EAAFQLLR | 0.000 | 0.000 | 0.000 | 0.000 | 0.564 | 0.436 | 0.000 | 0.000 | ||
| 4 spectra, TFESYFR | 0.000 | 0.177 | 0.000 | 0.000 | 0.621 | 0.202 | 0.000 | 0.000 |
| Plot | Mito | Lyso or Perox | ER | Golgi | PM | Cytosol | Nucleus | ||||||
| Expt B |
2 peptides |
3 spectra |
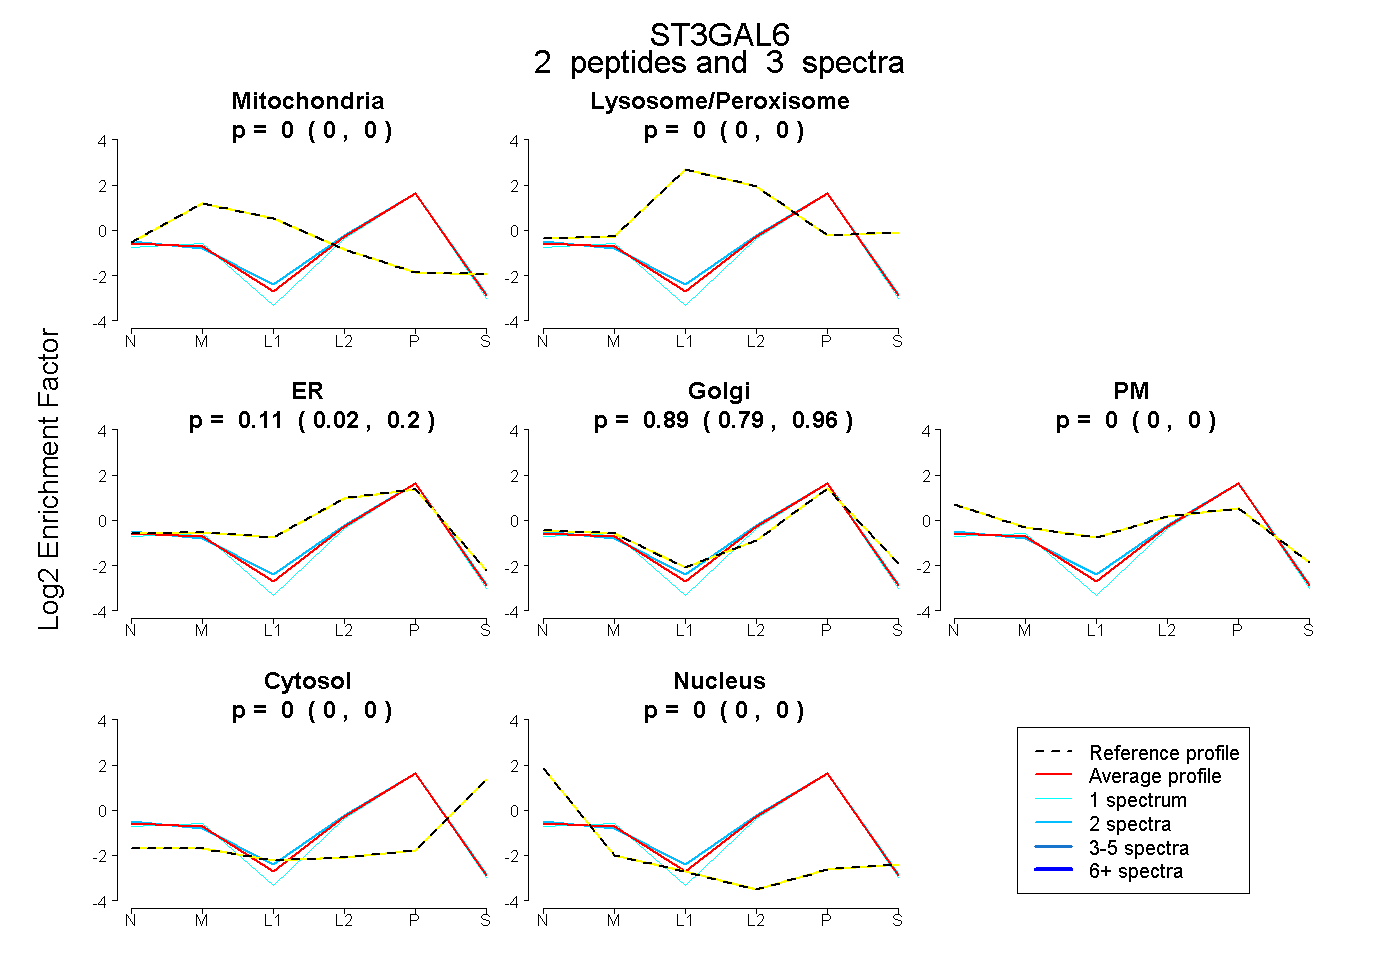 |
0.000 0.000 | 0.000 |
0.000 0.000 | 0.000 |
0.115 0.024 | 0.196 |
0.885 0.787 | 0.960 |
0.000 0.000 | 0.000 |
0.000 0.000 | 0.000 |
0.000 0.000 | 0.000 |
|||
| Plot | Lyso | Other | |||||||||||
| Expt C |
8 peptides |
24 spectra |
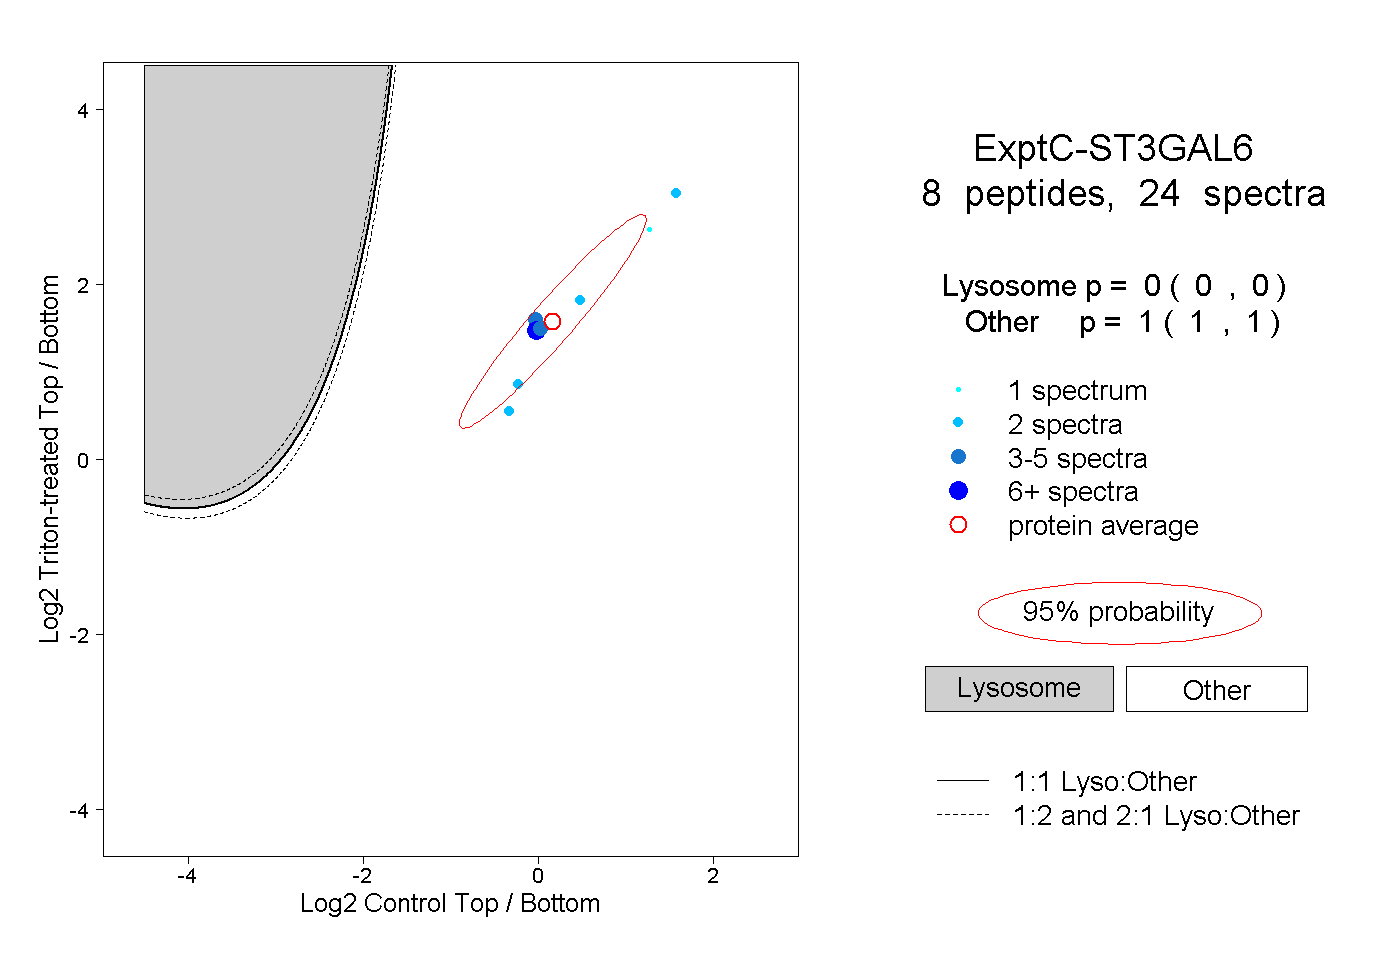 |
0.000 0.000 | 0.000 |
1.000 1.000 | 1.000 |
||||||||
| Plot | Lyso | Other | |||||||||||
| Expt D |
2 peptides |
3 spectra |
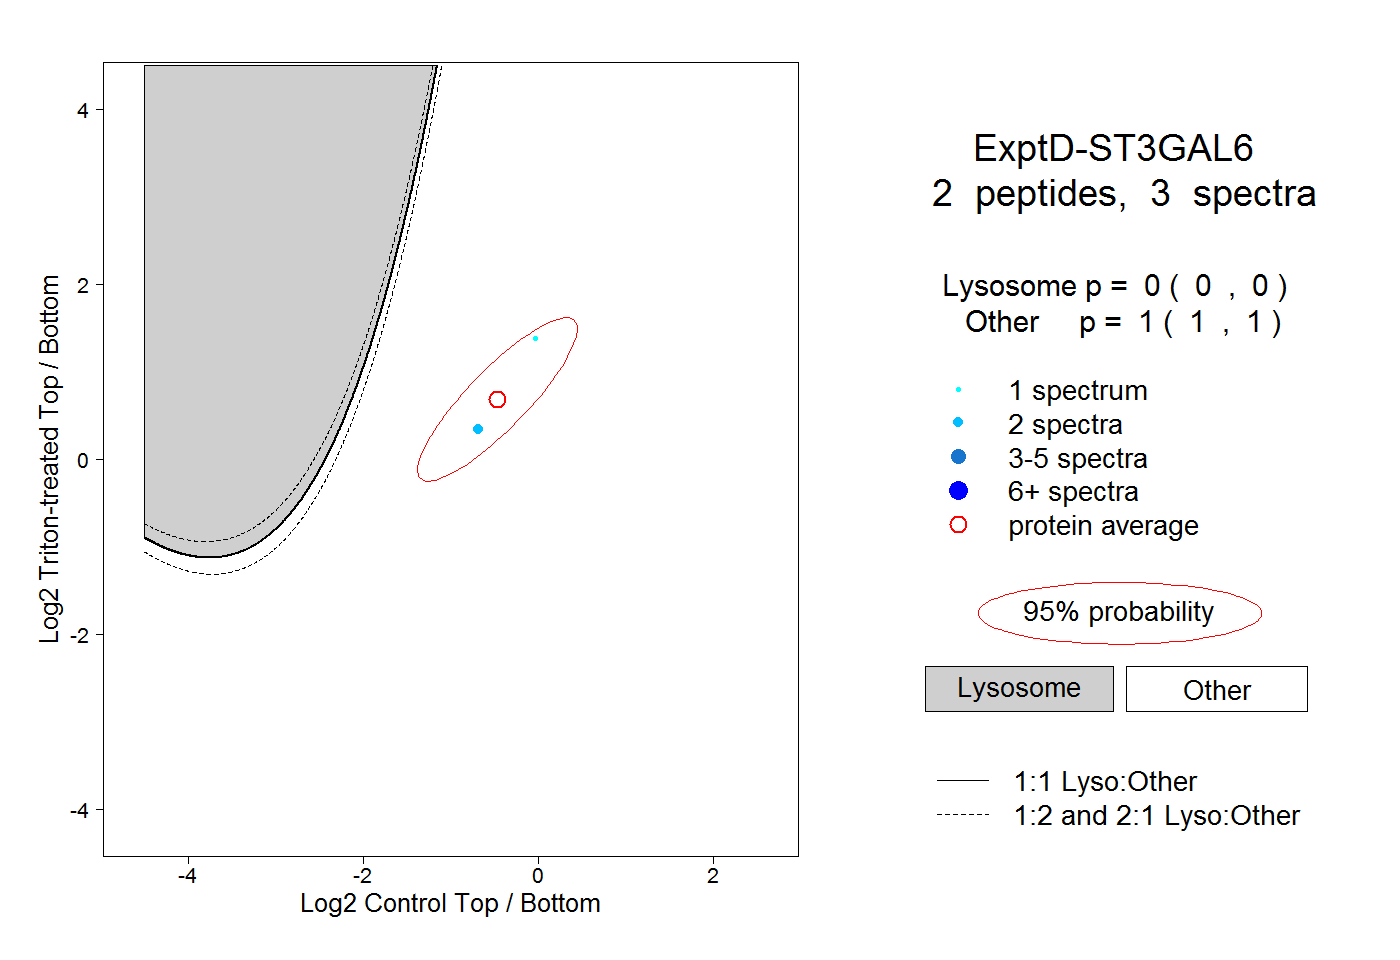 |
0.000 0.000 | 0.000 |
1.000 1.000 | 1.000 |