 7
7peptides
spectra
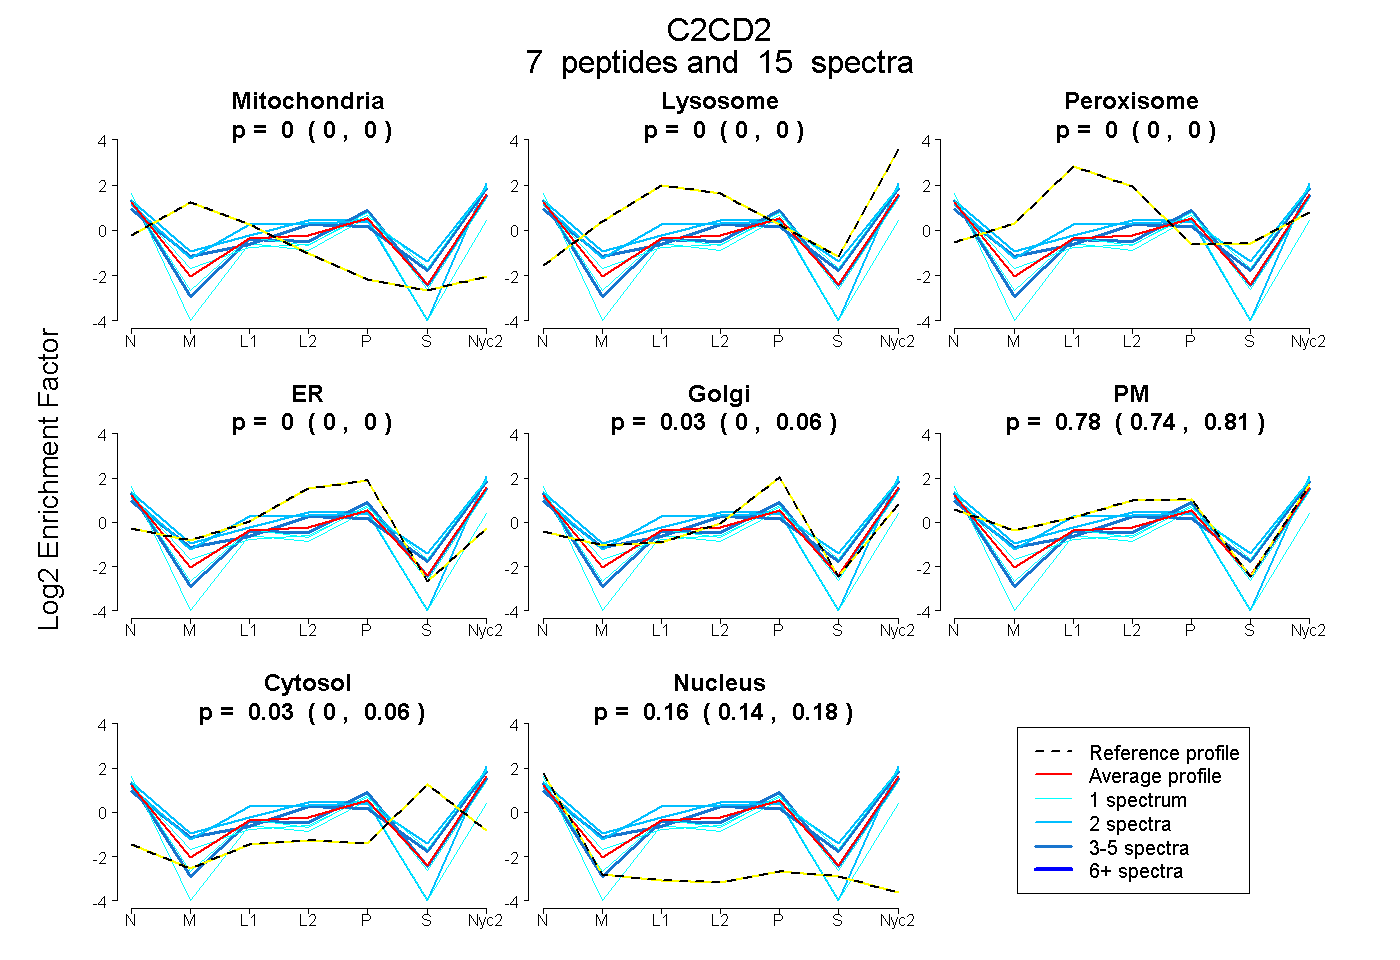
0.000 | 0.000
0.000 | 0.000
0.000 | 0.000
0.000 | 0.000
0.000 | 0.062
0.741 | 0.807
0.000 | 0.055
0.144 | 0.178
3peptides
spectra
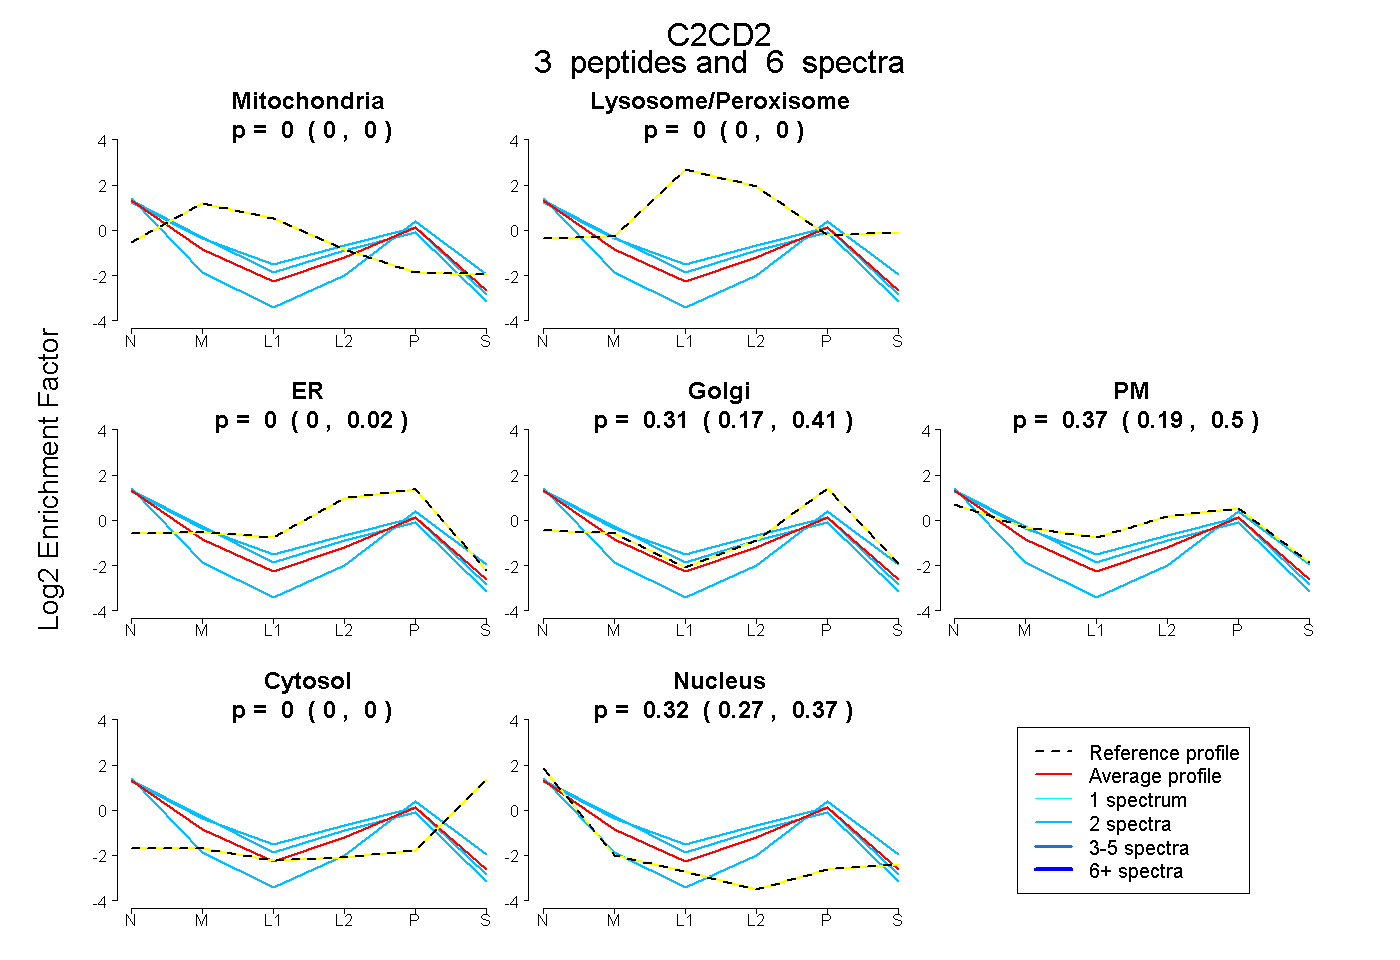
0.000 | 0.000
0.000 | 0.000
0.000 | 0.021
0.170 | 0.410
0.189 | 0.497
0.000 | 0.000
0.274 | 0.367
6peptides
spectra
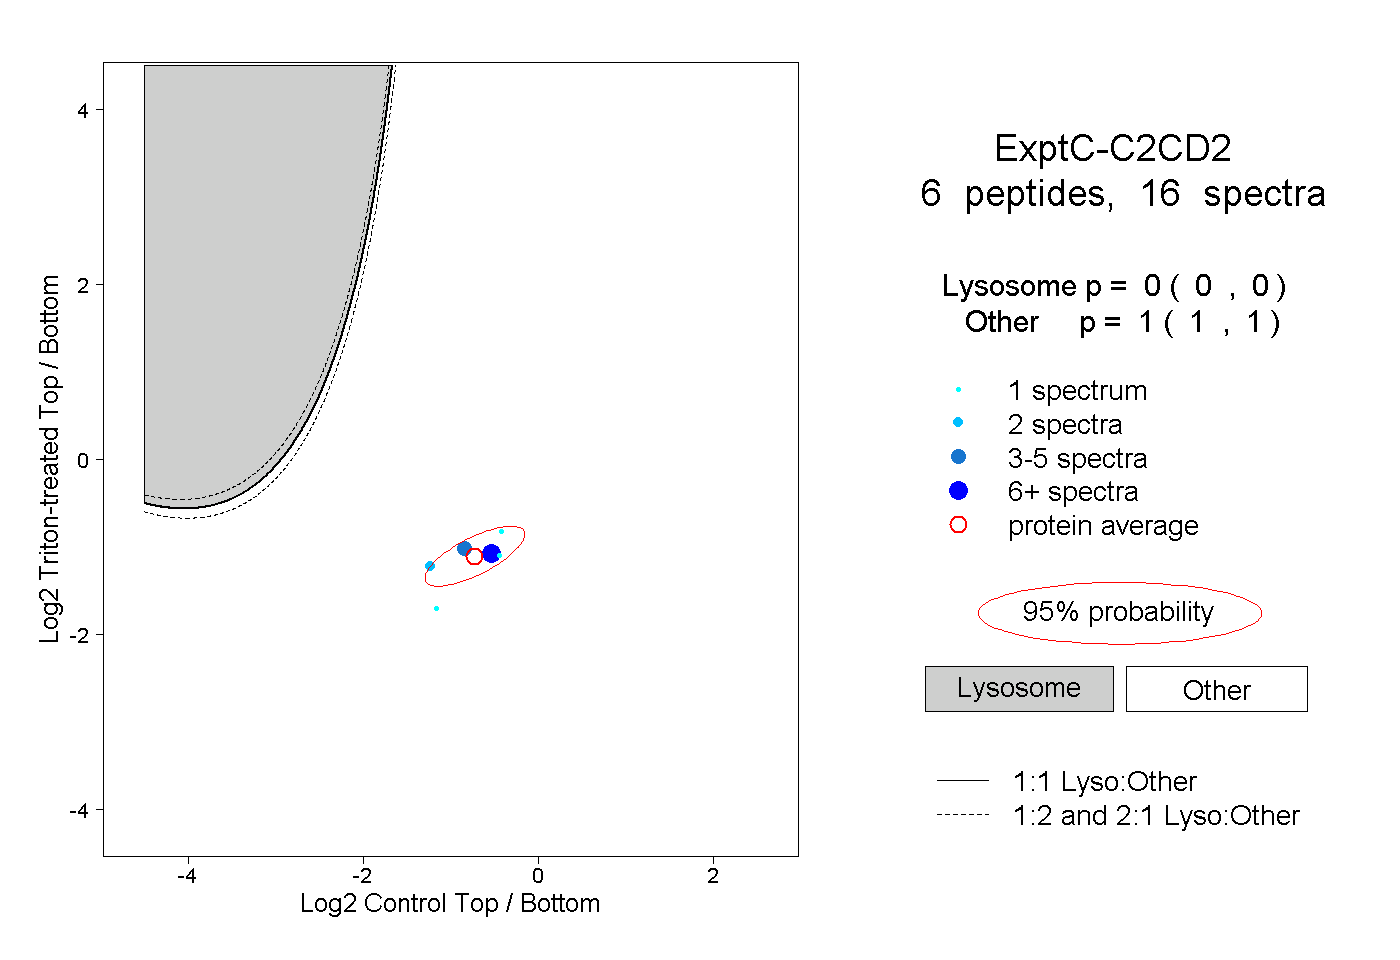
0.000 | 0.000
1.000 | 1.000