 7
7peptides
spectra
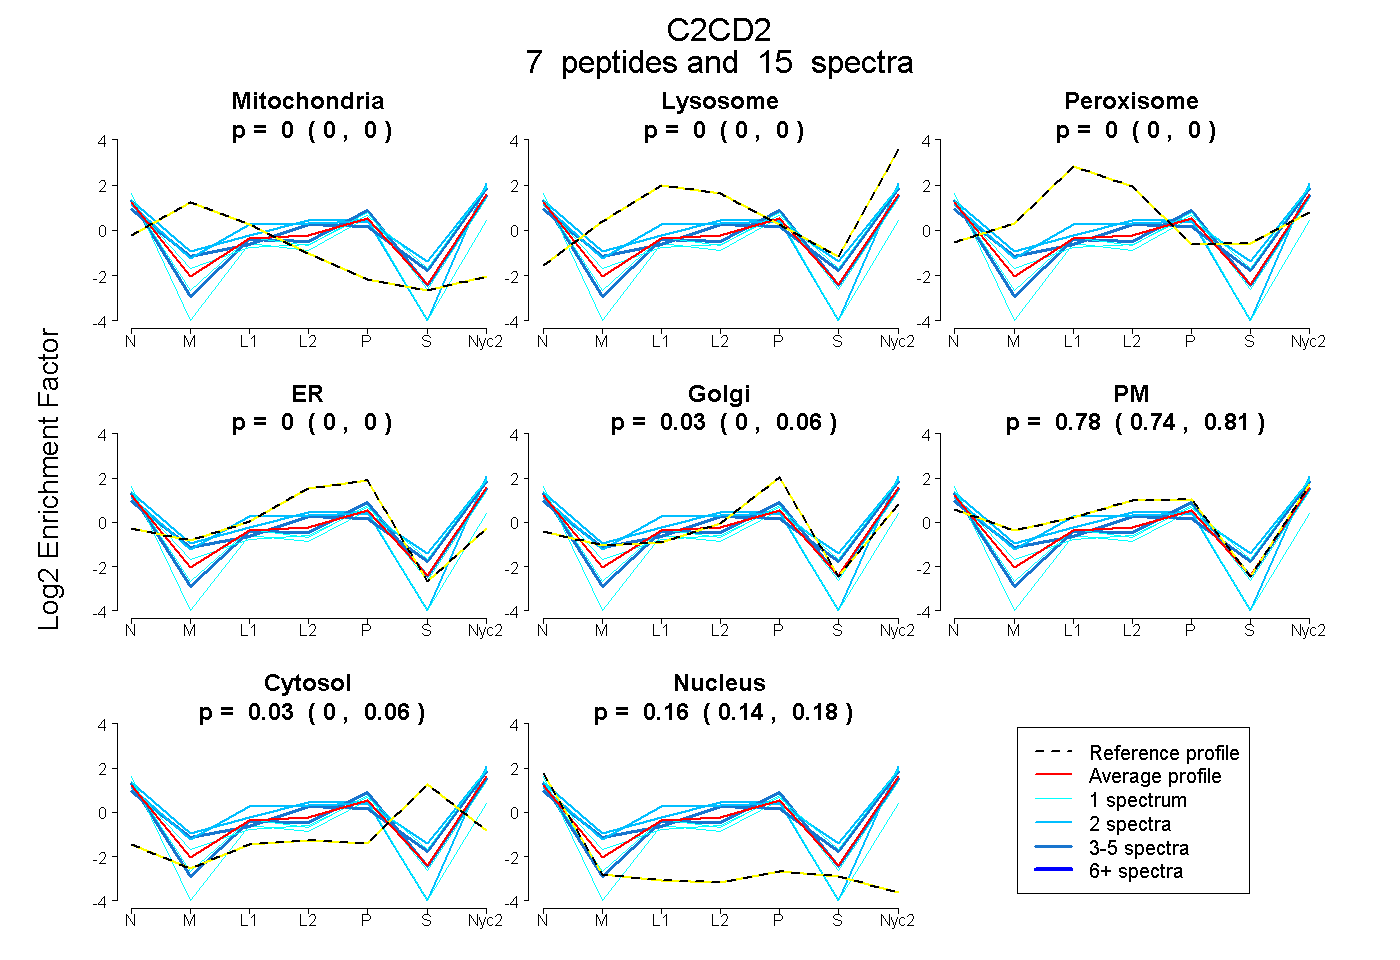
0.000 | 0.000
0.000 | 0.000
0.000 | 0.000
0.000 | 0.000
0.000 | 0.062
0.741 | 0.807
0.000 | 0.055
0.144 | 0.178
| Plot | Mito | Lyso | Perox | ER | Golgi | PM | Cytosol | Nucleus | |||||
| Expt A |
7 peptides |
15 spectra |
|
0.000 0.000 | 0.000 |
0.000 0.000 | 0.000 |
0.000 0.000 | 0.000 |
0.000 0.000 | 0.000 |
0.031 0.000 | 0.062 |
0.778 0.741 | 0.807 |
0.027 0.000 | 0.055 |
0.164 0.144 | 0.178 |
| 4 spectra, ASPLSSESPVR | 0.000 | 0.000 | 0.000 | 0.000 | 0.253 | 0.560 | 0.013 | 0.175 | ||
| 2 spectra, AEPDELR | 0.000 | 0.000 | 0.000 | 0.000 | 0.000 | 0.910 | 0.000 | 0.090 | ||
| 2 spectra, QPNGPQTFR | 0.000 | 0.002 | 0.000 | 0.000 | 0.000 | 0.829 | 0.169 | 0.000 | ||
| 1 spectrum, TVMPCGTVVTTVTAVK | 0.000 | 0.000 | 0.000 | 0.000 | 0.093 | 0.680 | 0.126 | 0.100 | ||
| 1 spectrum, EAQTLQCTSSTAQEPCPPKPPR | 0.000 | 0.000 | 0.000 | 0.000 | 0.266 | 0.384 | 0.000 | 0.350 | ||
| 1 spectrum, SWPAPPLVSATK | 0.000 | 0.000 | 0.000 | 0.000 | 0.194 | 0.601 | 0.000 | 0.205 | ||
| 4 spectra, FISTLVR | 0.000 | 0.000 | 0.000 | 0.000 | 0.000 | 0.798 | 0.138 | 0.064 |
| Plot | Mito | Lyso or Perox | ER | Golgi | PM | Cytosol | Nucleus | ||||||
| Expt B |
3 peptides |
6 spectra |
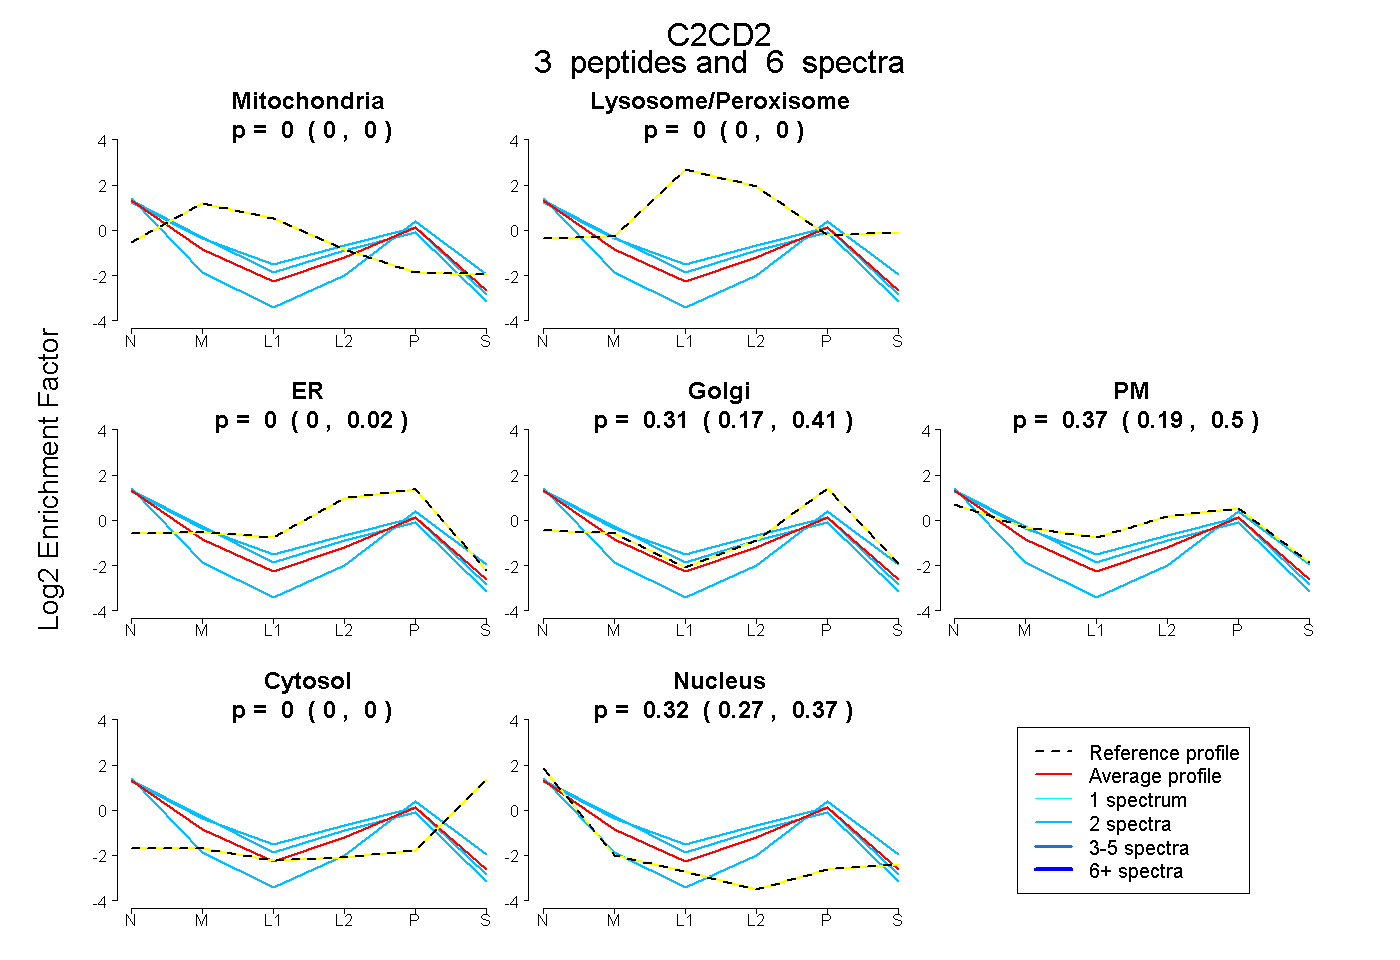 |
0.000 0.000 | 0.000 |
0.000 0.000 | 0.000 |
0.000 0.000 | 0.021 |
0.310 0.170 | 0.410 |
0.365 0.189 | 0.497 |
0.000 0.000 | 0.000 |
0.324 0.274 | 0.367 |
|||
| Plot | Lyso | Other | |||||||||||
| Expt C |
6 peptides |
16 spectra |
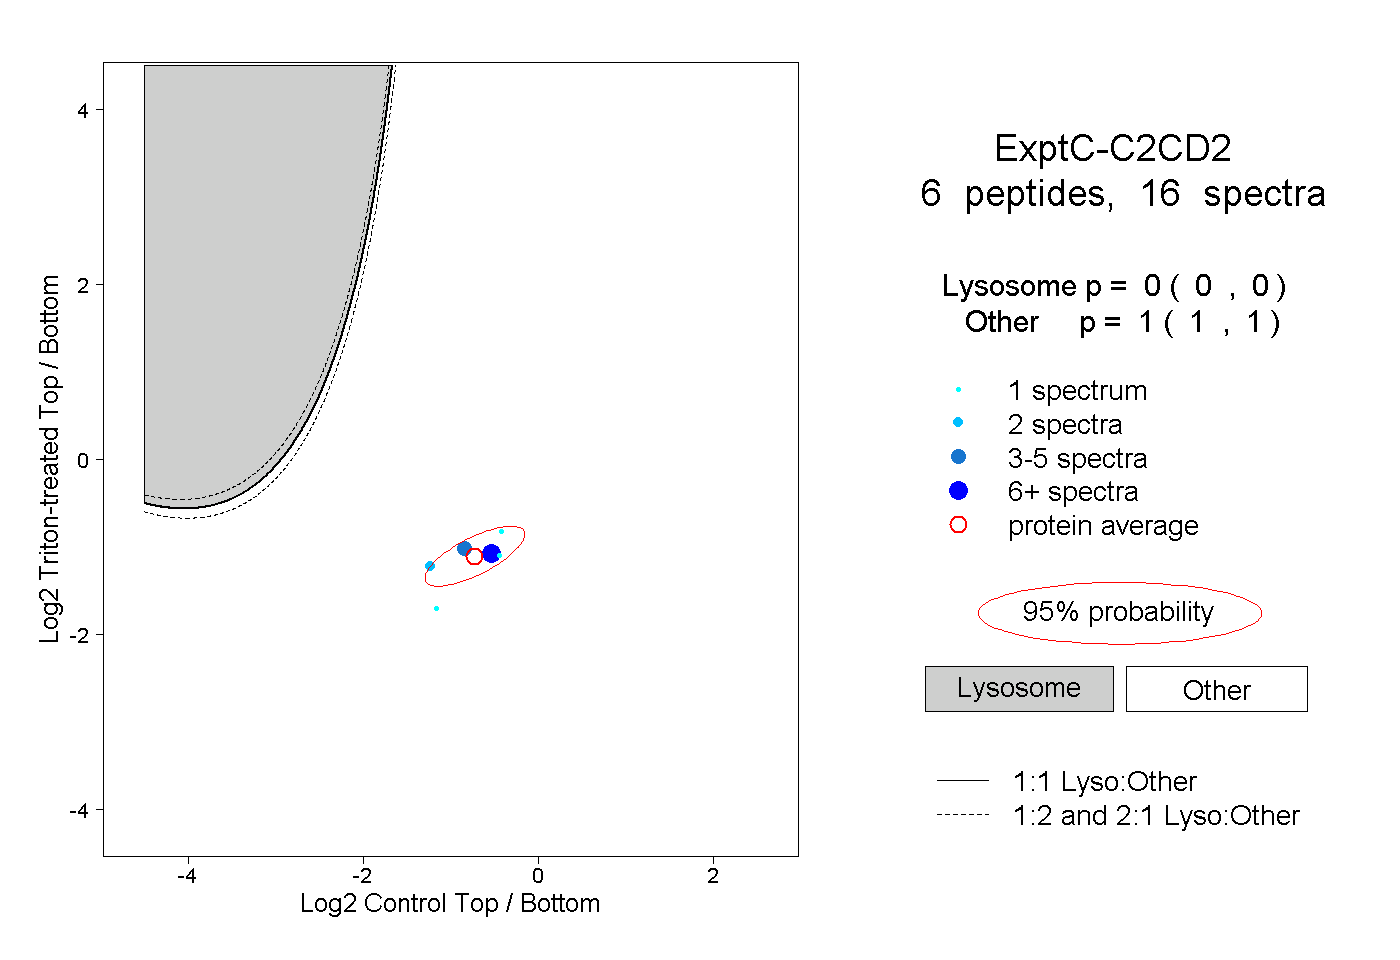 |
0.000 0.000 | 0.000 |
1.000 1.000 | 1.000 |