 23
23peptides
spectra
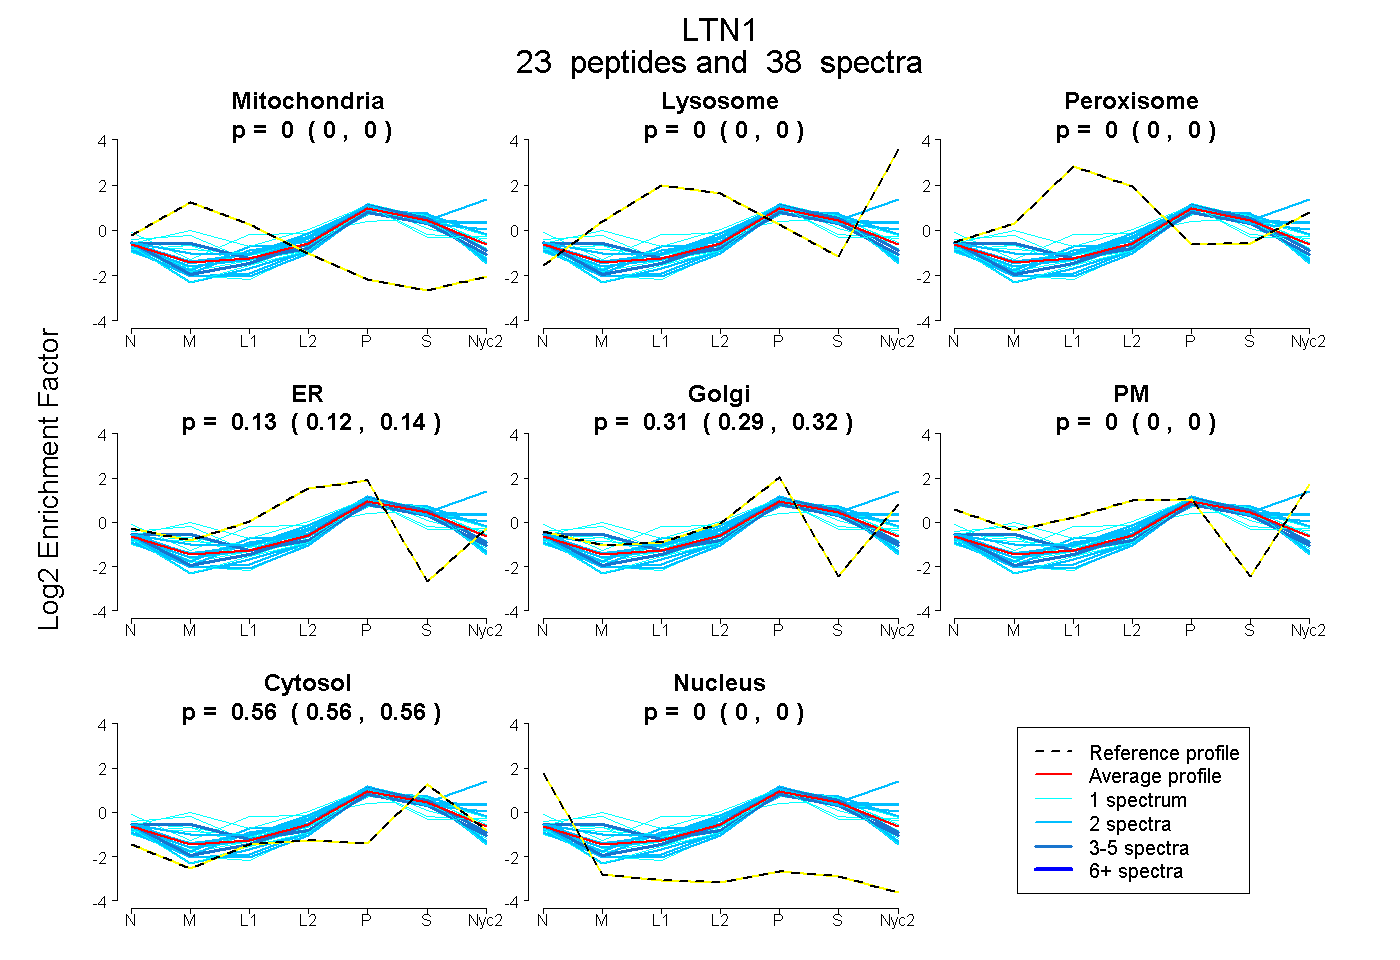
0.000 | 0.000
0.000 | 0.000
0.000 | 0.000
0.115 | 0.142
0.292 | 0.324
0.000 | 0.000
0.556 | 0.564
0.000 | 0.000
2peptides
spectra
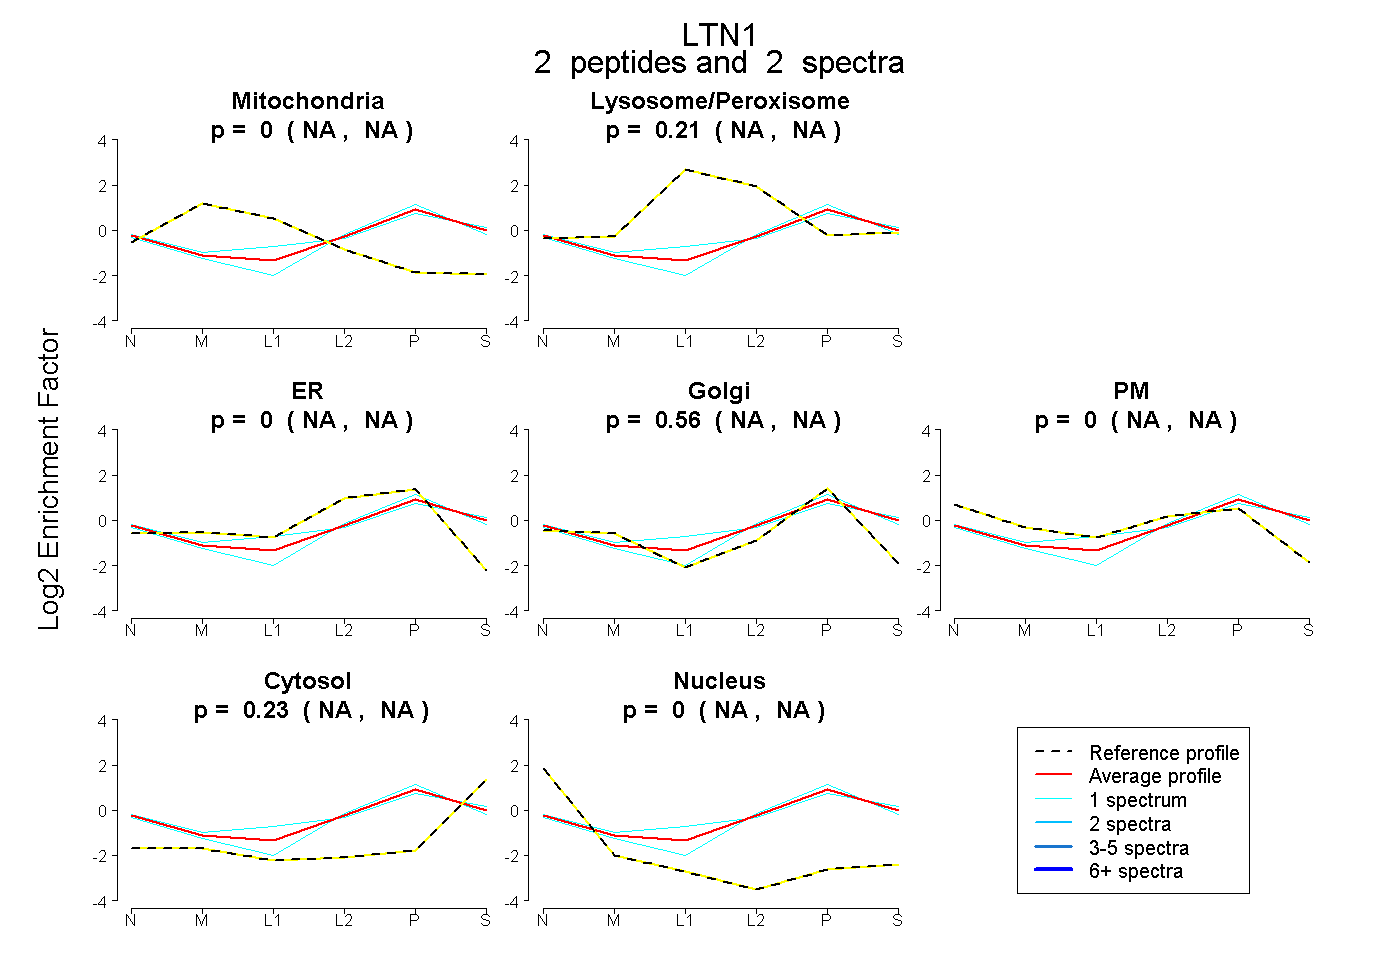
NA | NA
NA | NA
NA | NA
NA | NA
NA | NA
NA | NA
NA | NA
10peptides
spectra
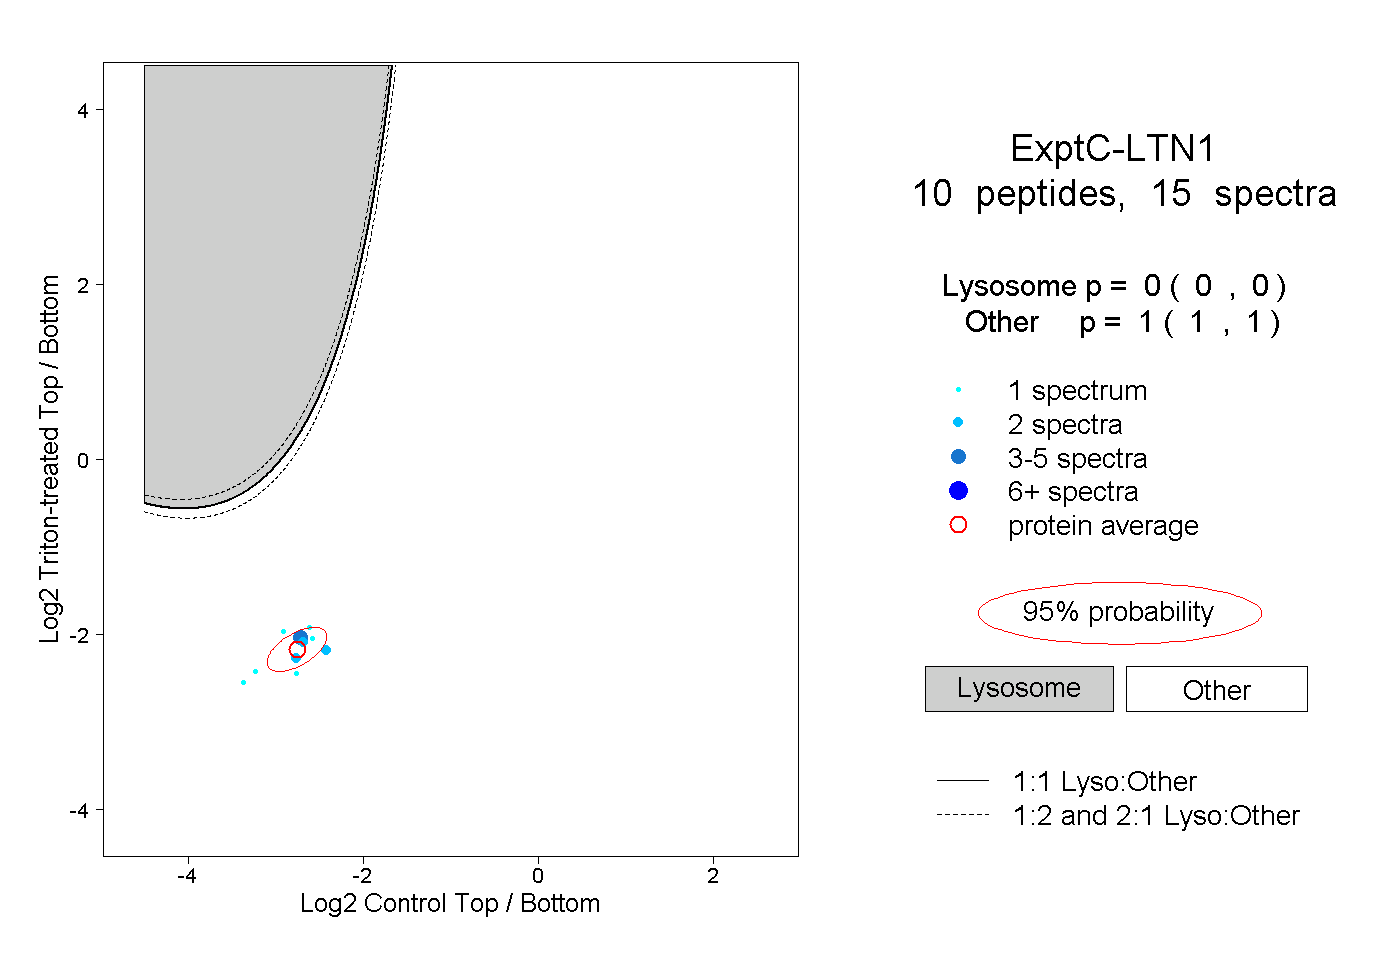
0.000 | 0.000
1.000 | 1.000
2peptides
spectra
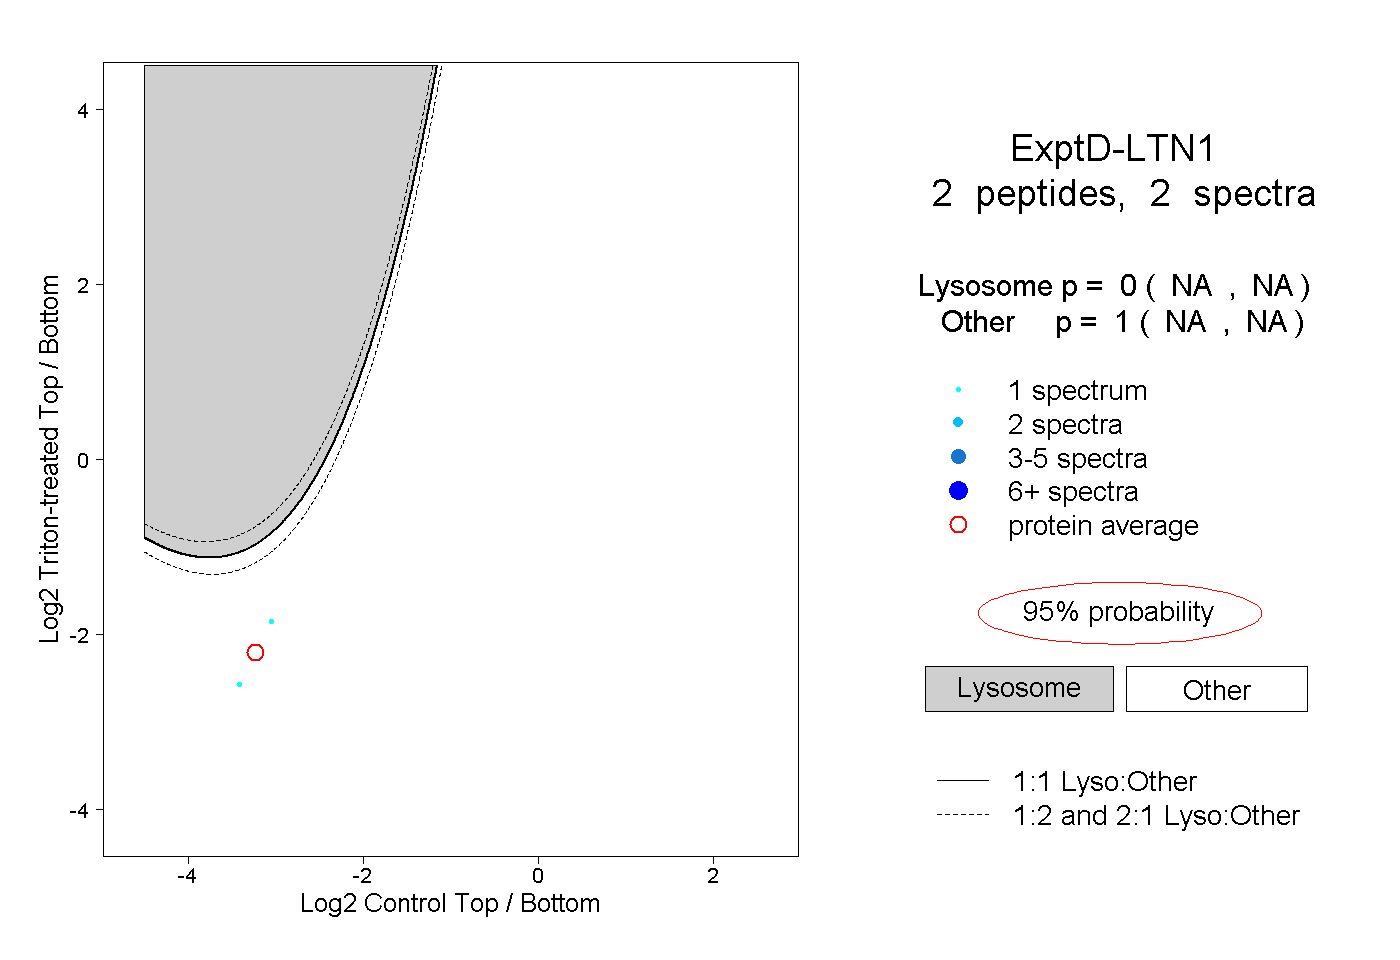
NA | NA
NA | NA