 23
23peptides
spectra
0.000 | 0.000
0.000 | 0.000
0.000 | 0.000
0.115 | 0.142
0.292 | 0.324
0.000 | 0.000
0.556 | 0.564
0.000 | 0.000
2peptides
spectra
NA | NA
NA | NA
NA | NA
NA | NA
NA | NA
NA | NA
NA | NA
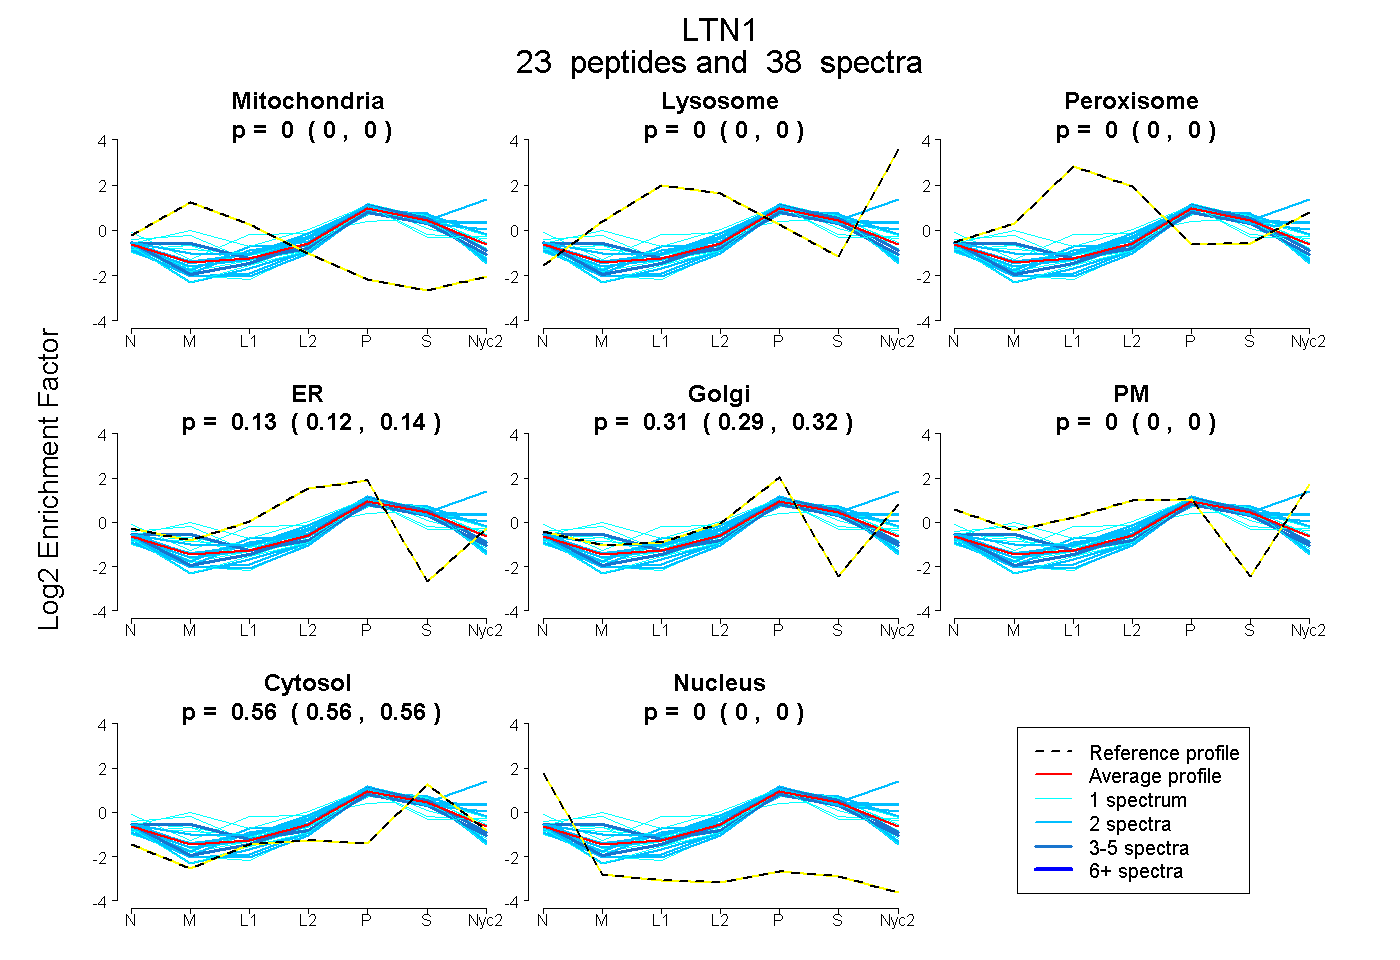
| Plot | Mito | Lyso | Perox | ER | Golgi | PM | Cytosol | Nucleus | |||||
| Expt A |
23 peptides |
38 spectra |
|
0.000 0.000 | 0.000 |
0.000 0.000 | 0.000 |
0.000 0.000 | 0.000 |
0.130 0.115 | 0.142 |
0.310 0.292 | 0.324 |
0.000 0.000 | 0.000 |
0.560 0.556 | 0.564 |
0.000 0.000 | 0.000 |
||
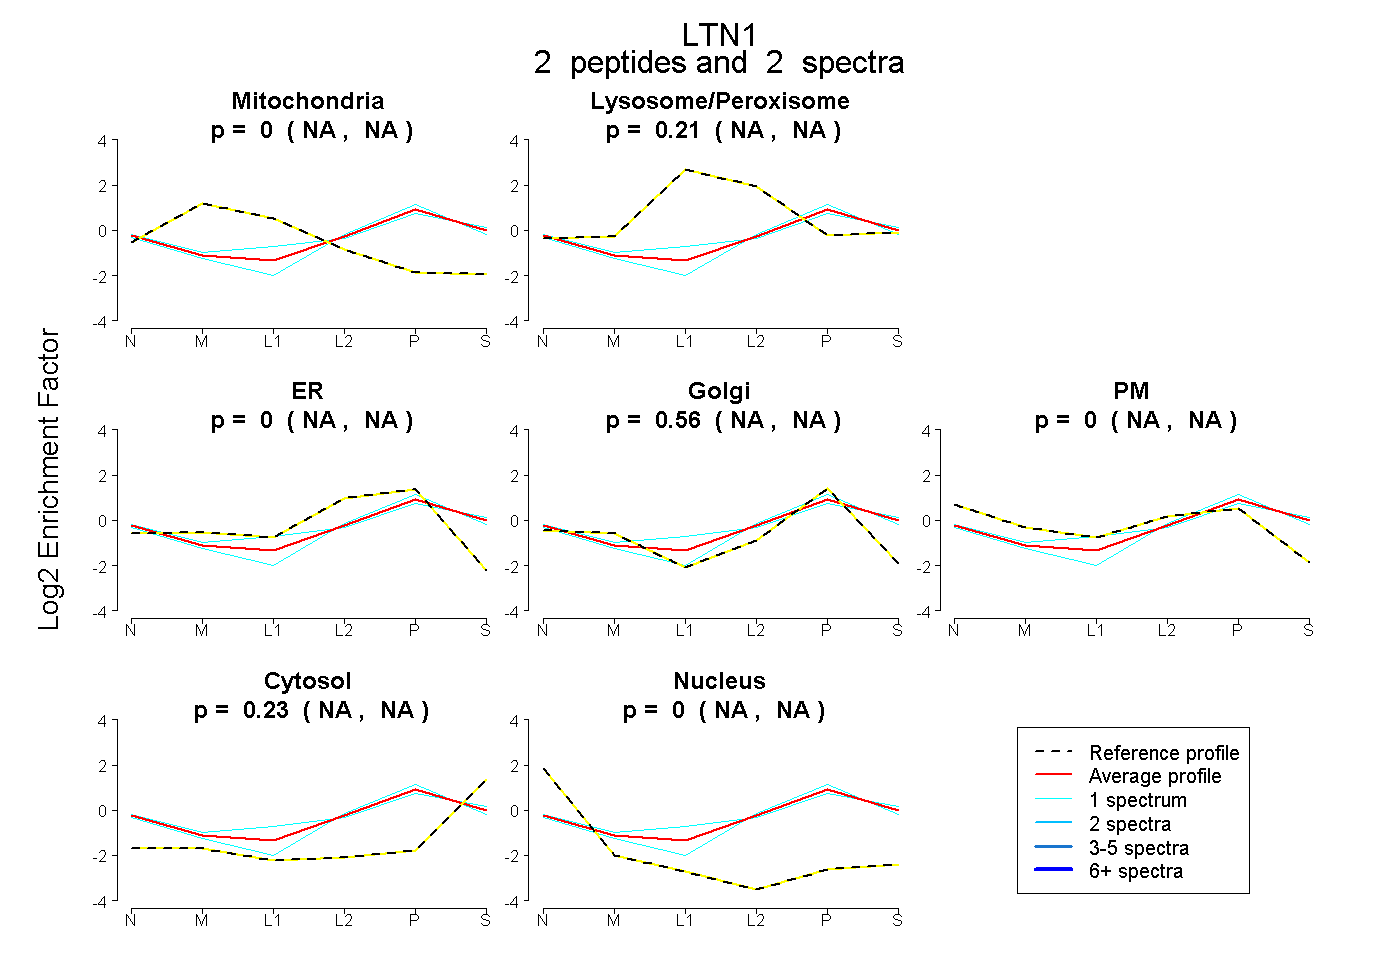
| Plot | Mito | Lyso or Perox | ER | Golgi | PM | Cytosol | Nucleus | ||||||
| Expt B |
2 peptides |
2 spectra |
|
0.000 NA | NA |
0.214 NA | NA |
0.000 NA | NA |
0.558 NA | NA |
0.000 NA | NA |
0.228 NA | NA |
0.000 NA | NA |
| 1 spectrum, LVALADCLCGK | 0.000 | 0.307 | 0.000 | 0.451 | 0.000 | 0.242 | 0.000 | |||
| 1 spectrum, VFNIVDR | 0.000 | 0.025 | 0.285 | 0.415 | 0.000 | 0.275 | 0.000 |
| Plot | Lyso | Other | |||||||||||
| Expt C |
10 peptides |
15 spectra |
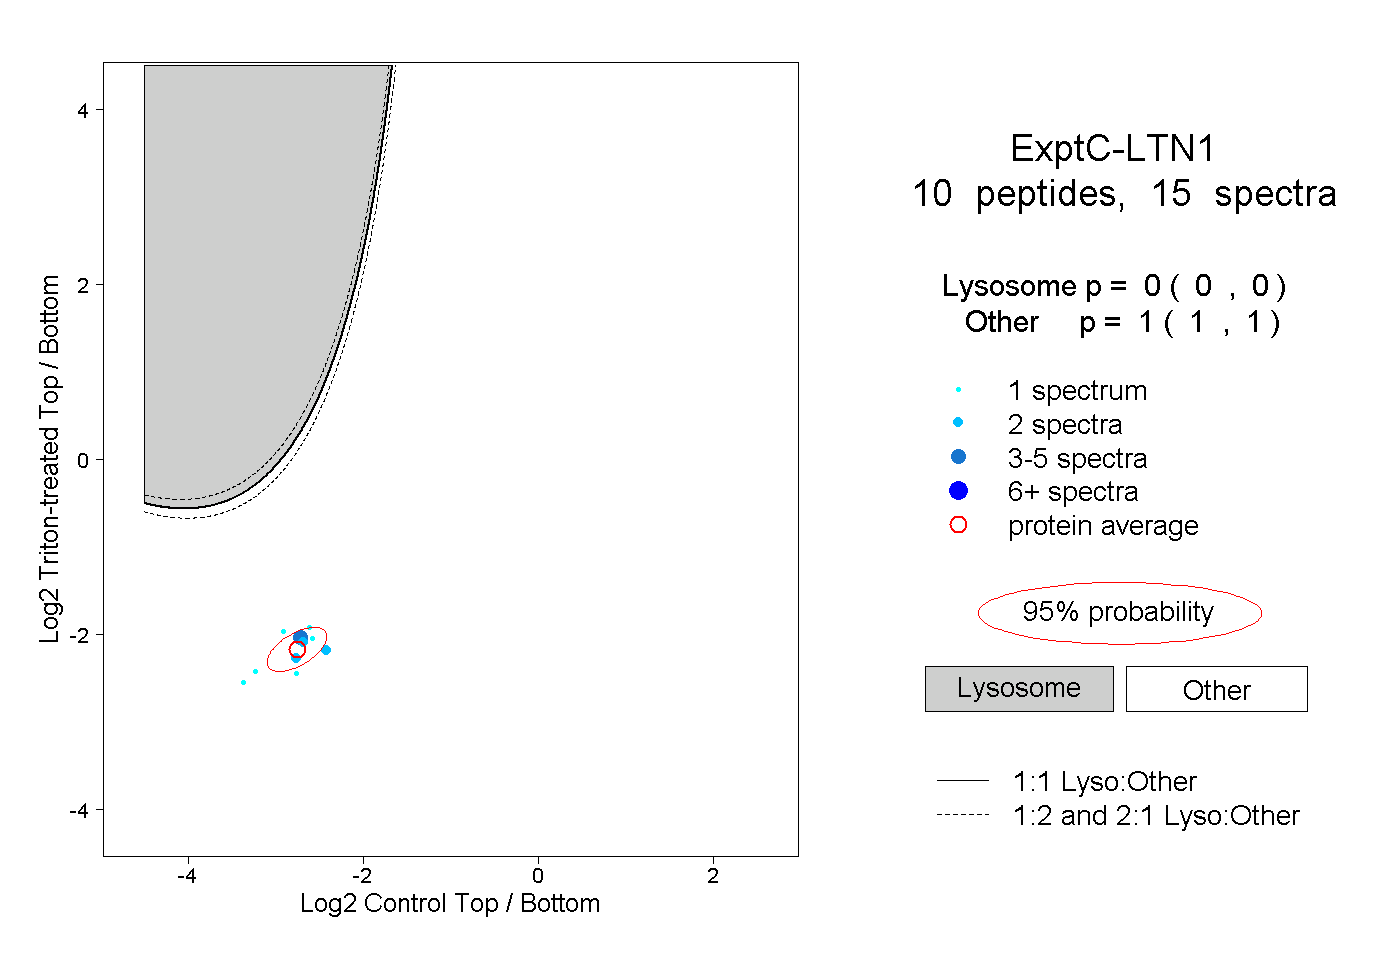 |
0.000 0.000 | 0.000 |
1.000 1.000 | 1.000 |
||||||||
| Plot | Lyso | Other | |||||||||||
| Expt D |
2 peptides |
2 spectra |
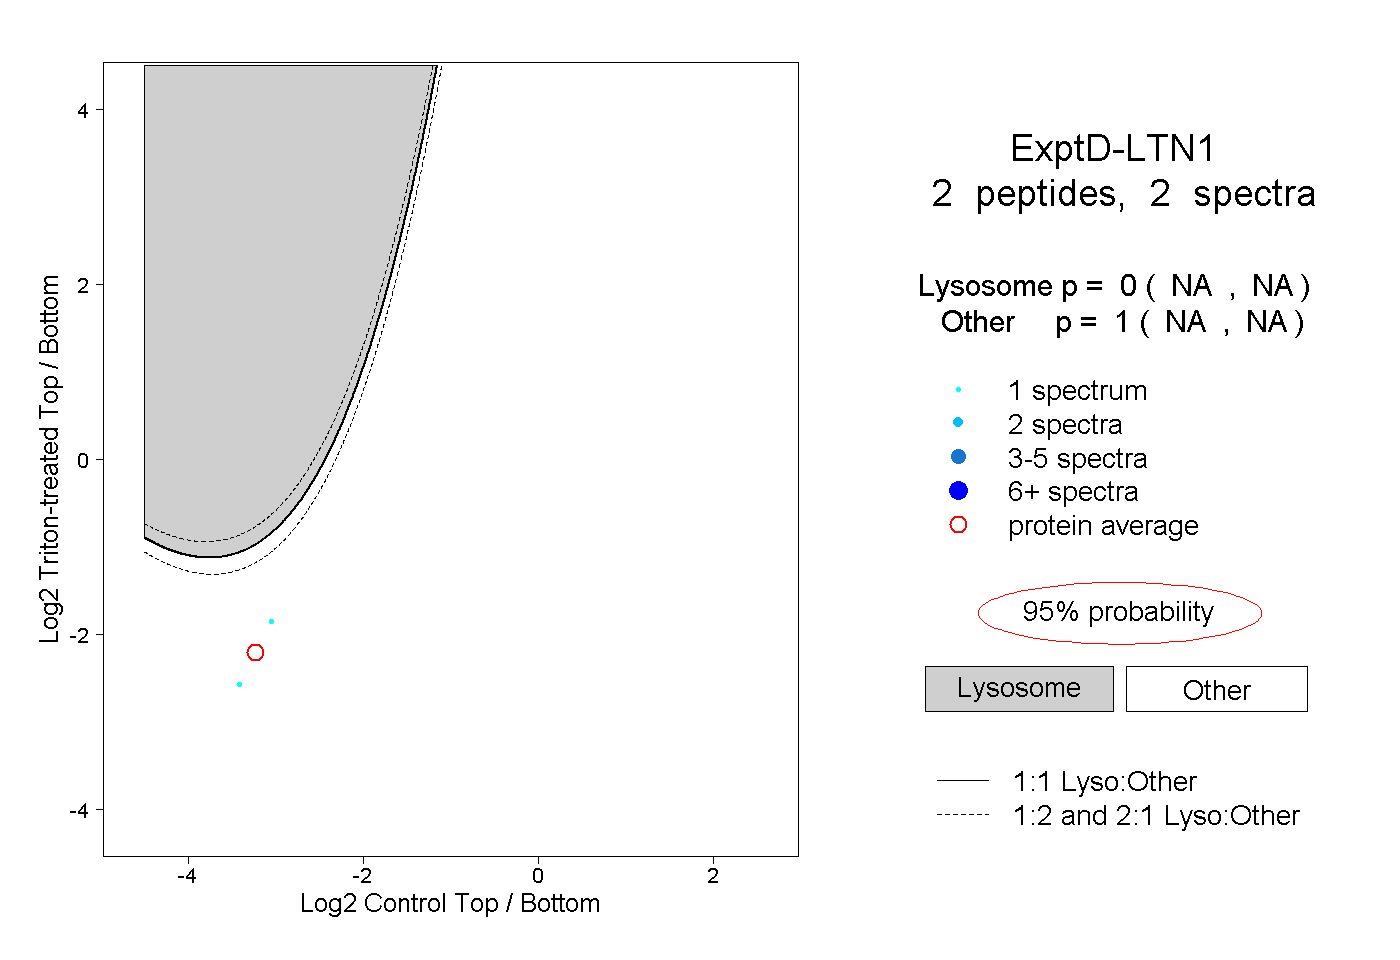 |
0.000 NA | NA |
1.000 NA | NA |