 32
32peptides
spectra
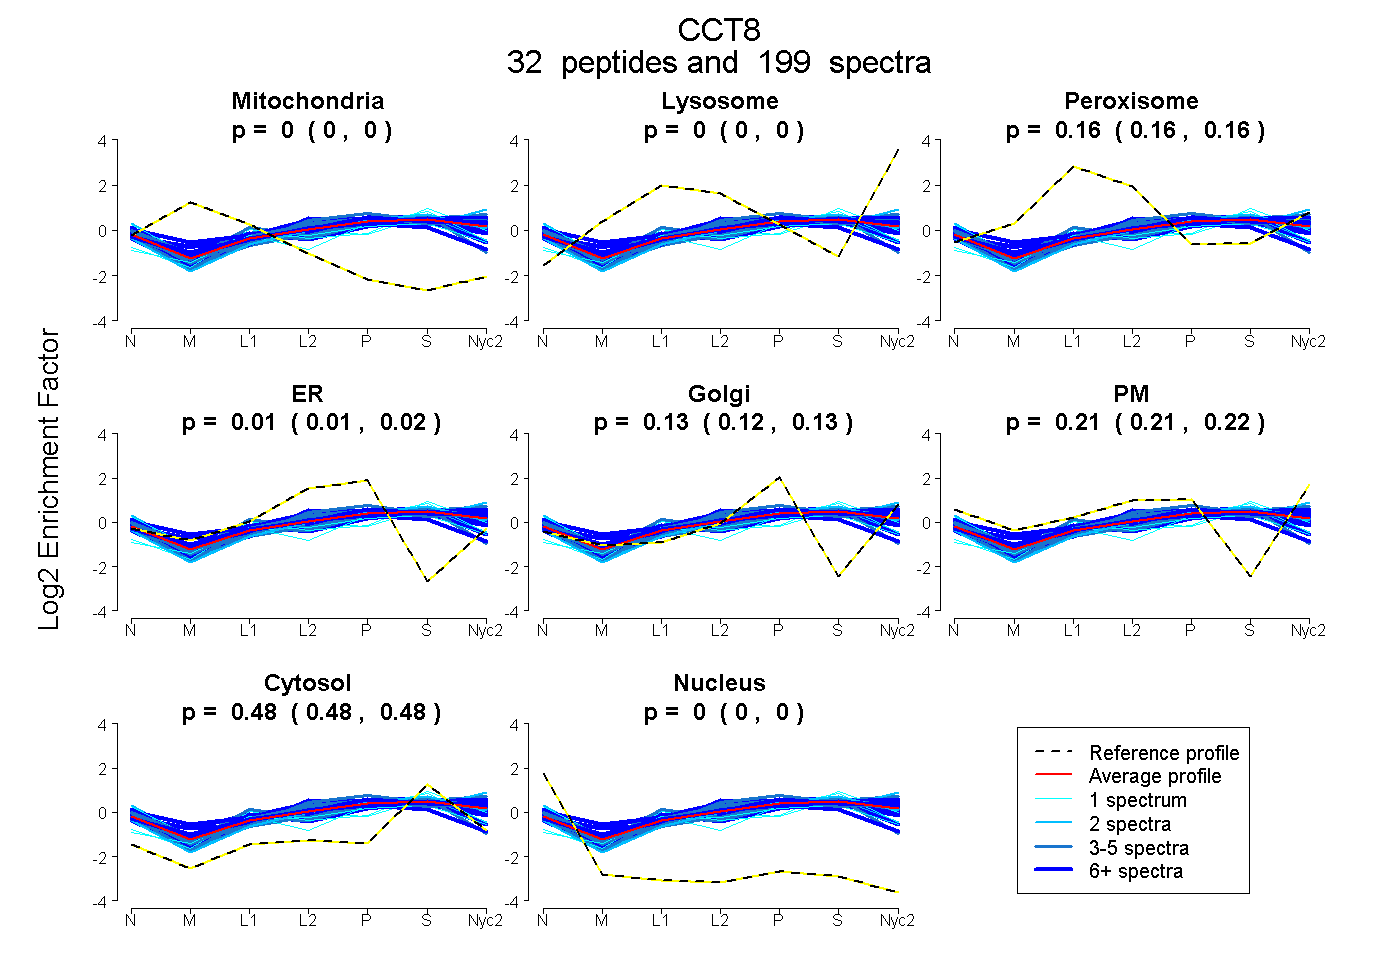
0.000 | 0.000
0.000 | 0.000
0.159 | 0.163
0.009 | 0.019
0.123 | 0.134
0.210 | 0.217
0.480 | 0.483
0.000 | 0.000
19peptides
spectra
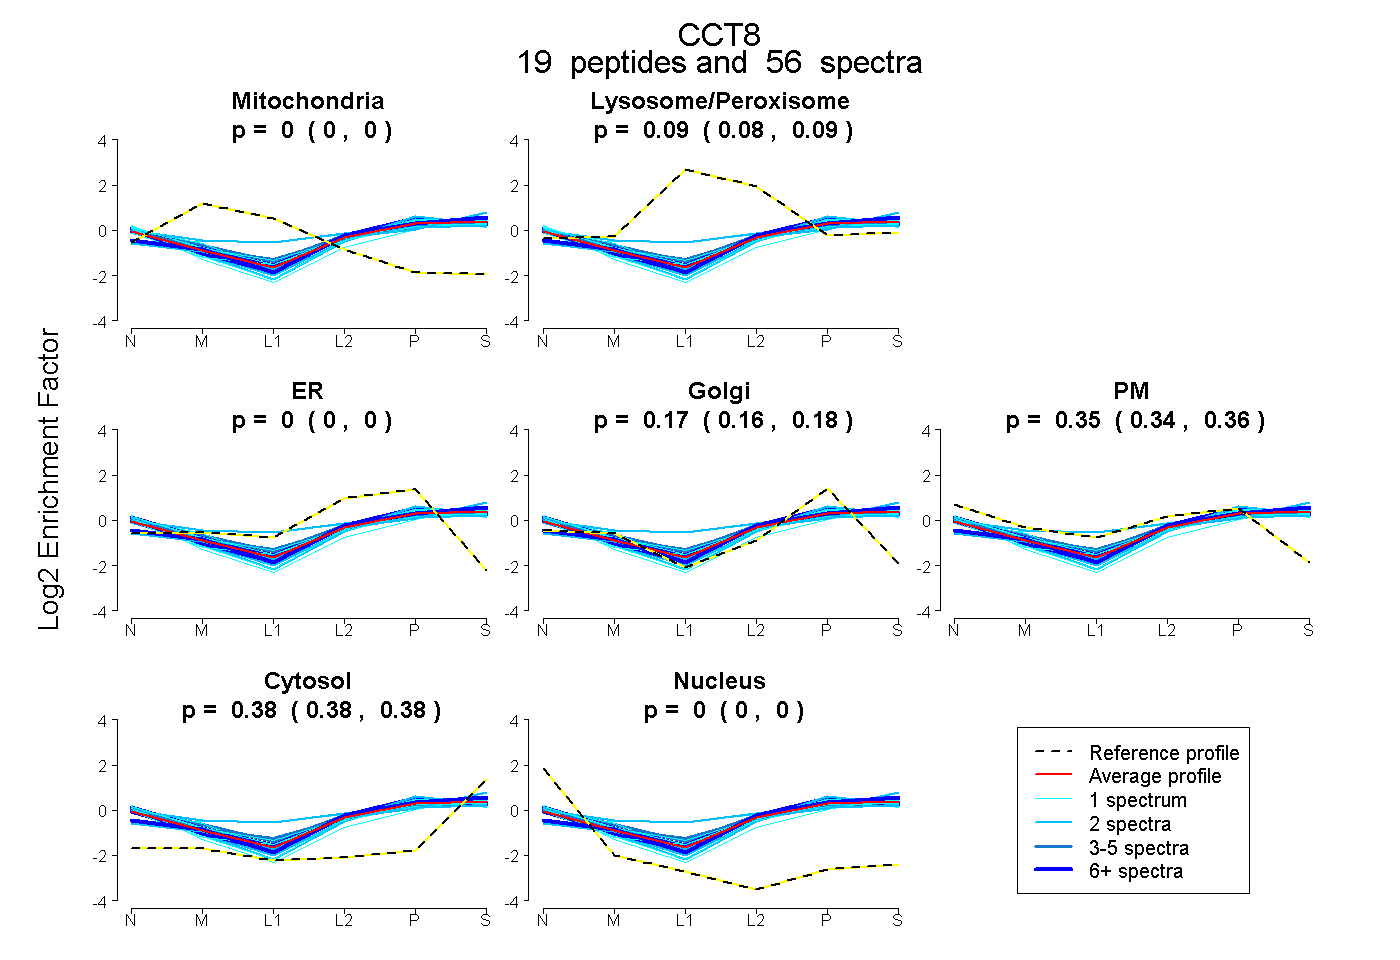
0.000 | 0.000
0.084 | 0.094
0.000 | 0.000
0.164 | 0.180
0.343 | 0.364
0.381 | 0.385
0.000 | 0.000
29peptides
spectra
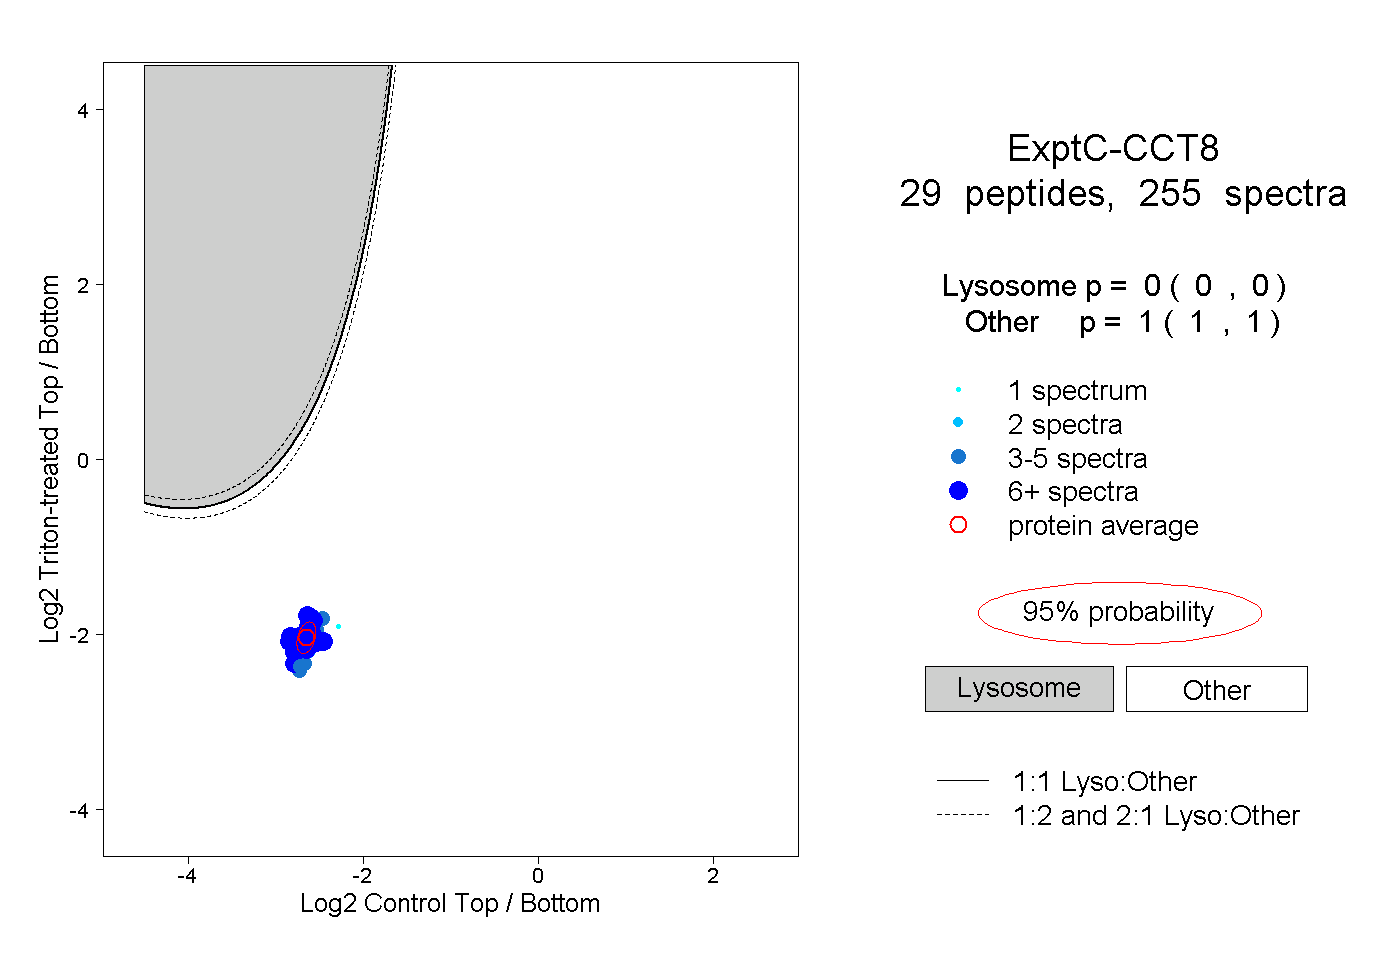
0.000 | 0.000
1.000 | 1.000
9peptides
spectra
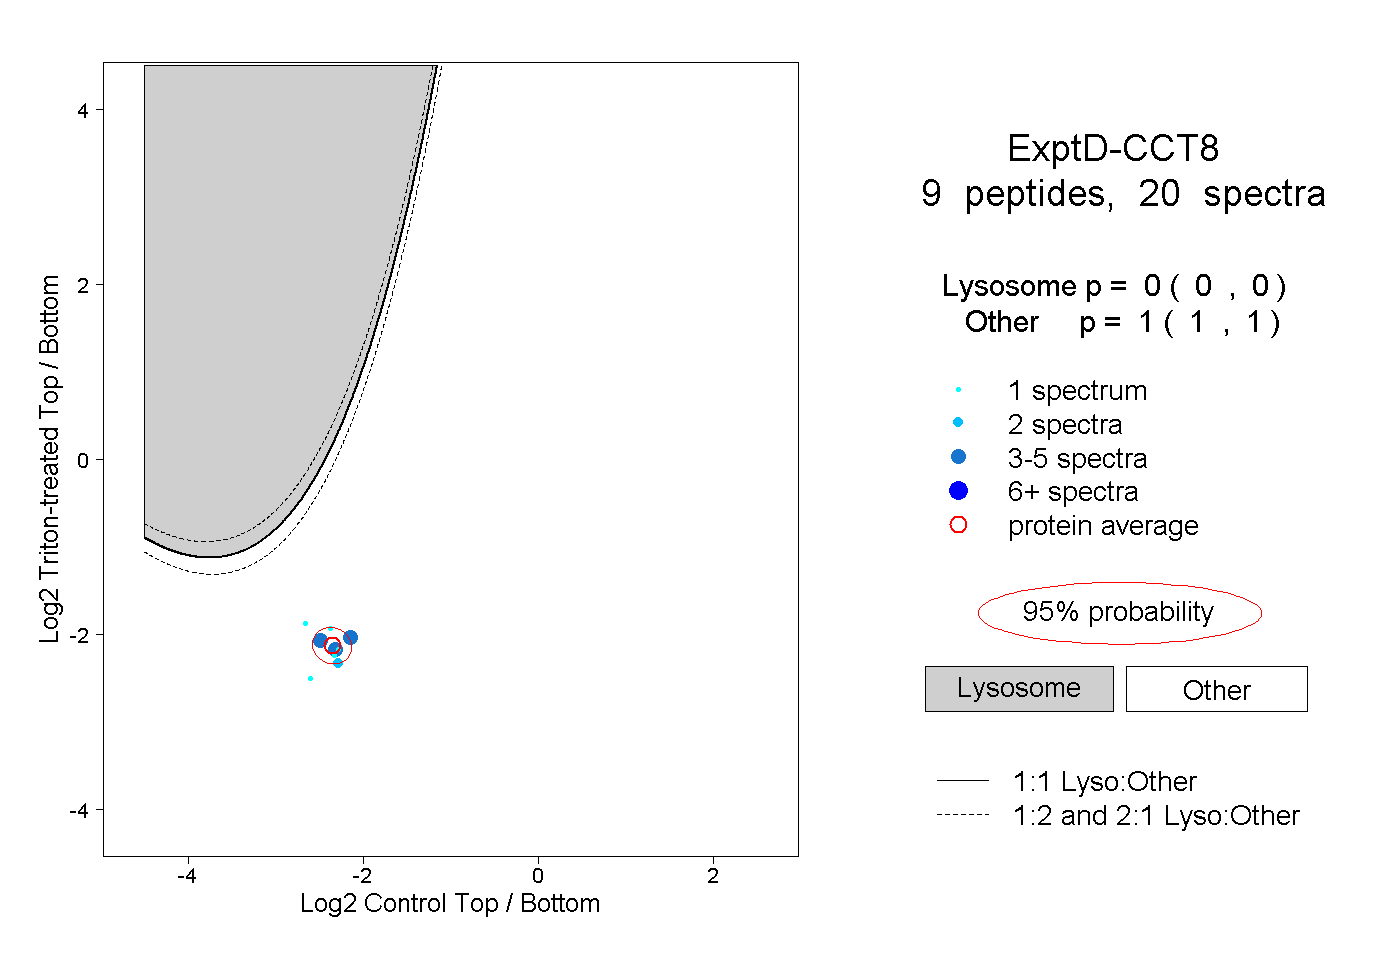
0.000 | 0.000
1.000 | 1.000