 7
7peptides
spectra
0.000 | 0.000
0.000 | 0.000
0.000 | 0.019
0.000 | 0.000
0.000 | 0.000
0.006 | 0.077
0.690 | 0.725
0.210 | 0.266
1peptide
spectrum
NA | NA
NA | NA
NA | NA
NA | NA
NA | NA
NA | NA
NA | NA
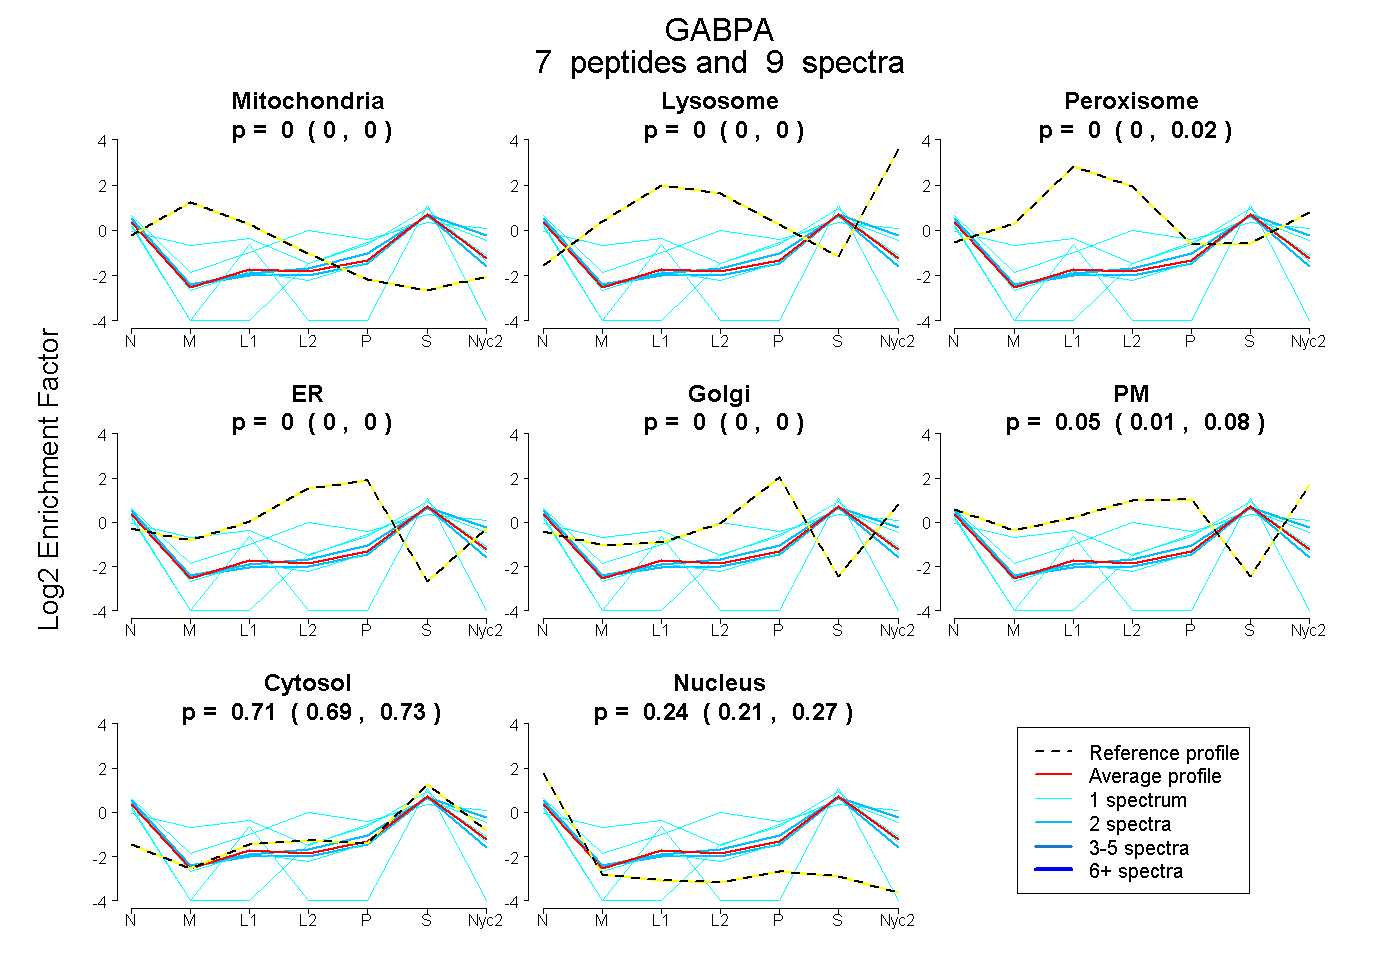
| Plot | Mito | Lyso | Perox | ER | Golgi | PM | Cytosol | Nucleus | |||||
| Expt A |
7 peptides |
9 spectra |
|
0.000 0.000 | 0.000 |
0.000 0.000 | 0.000 |
0.000 0.000 | 0.019 |
0.000 0.000 | 0.000 |
0.000 0.000 | 0.000 |
0.047 0.006 | 0.077 |
0.712 0.690 | 0.725 |
0.241 0.210 | 0.266 |
||
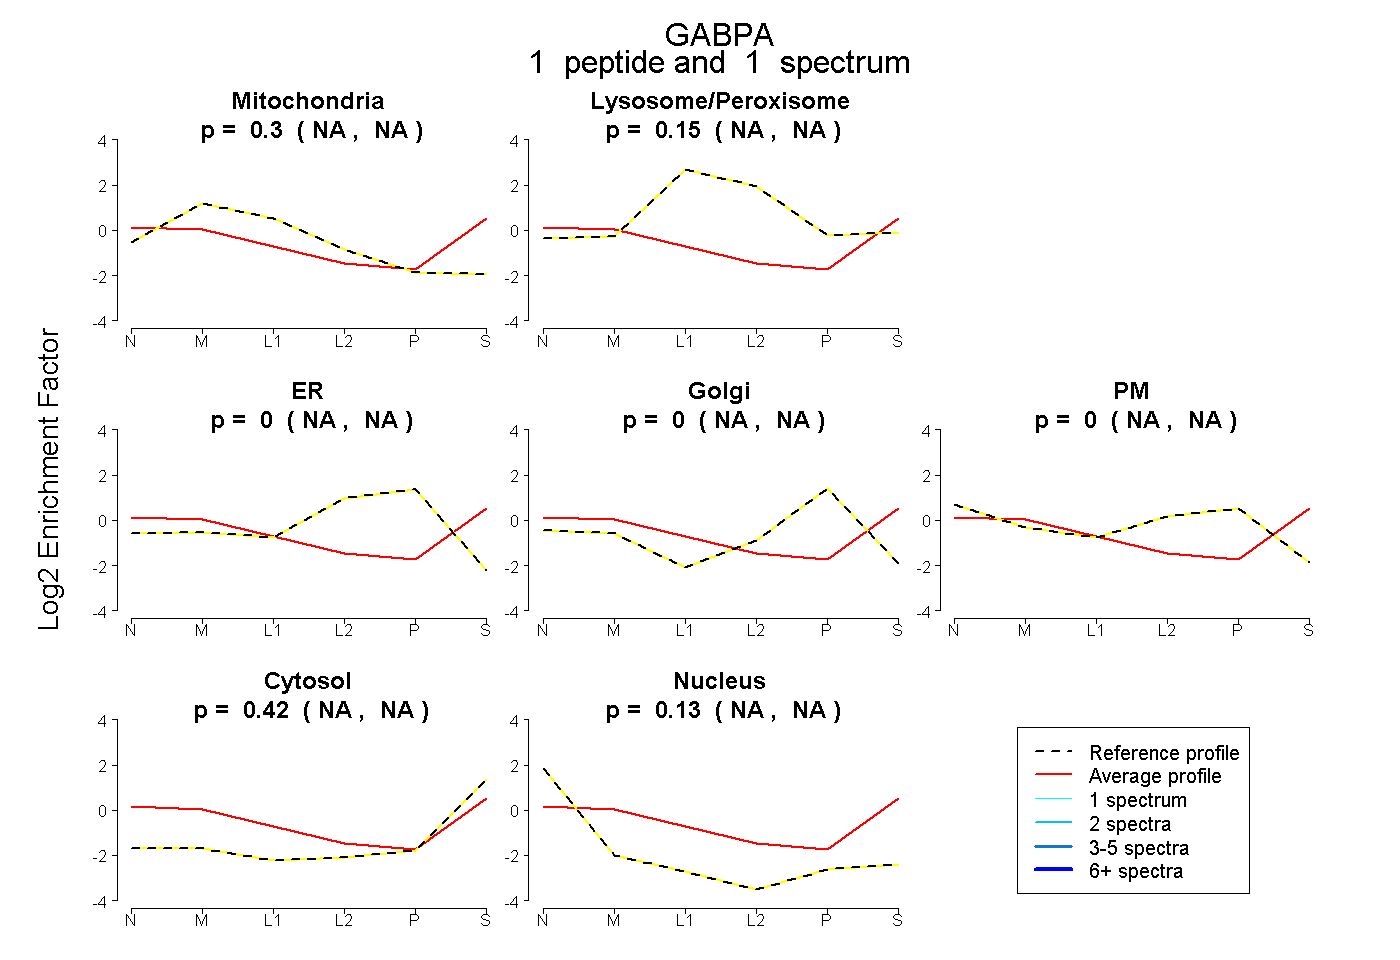
| Plot | Mito | Lyso or Perox | ER | Golgi | PM | Cytosol | Nucleus | ||||||
| Expt B |
1 peptide |
1 spectrum |
|
0.298 NA | NA |
0.151 NA | NA |
0.000 NA | NA |
0.000 NA | NA |
0.000 NA | NA |
0.424 NA | NA |
0.127 NA | NA |