 7
7peptides
spectra
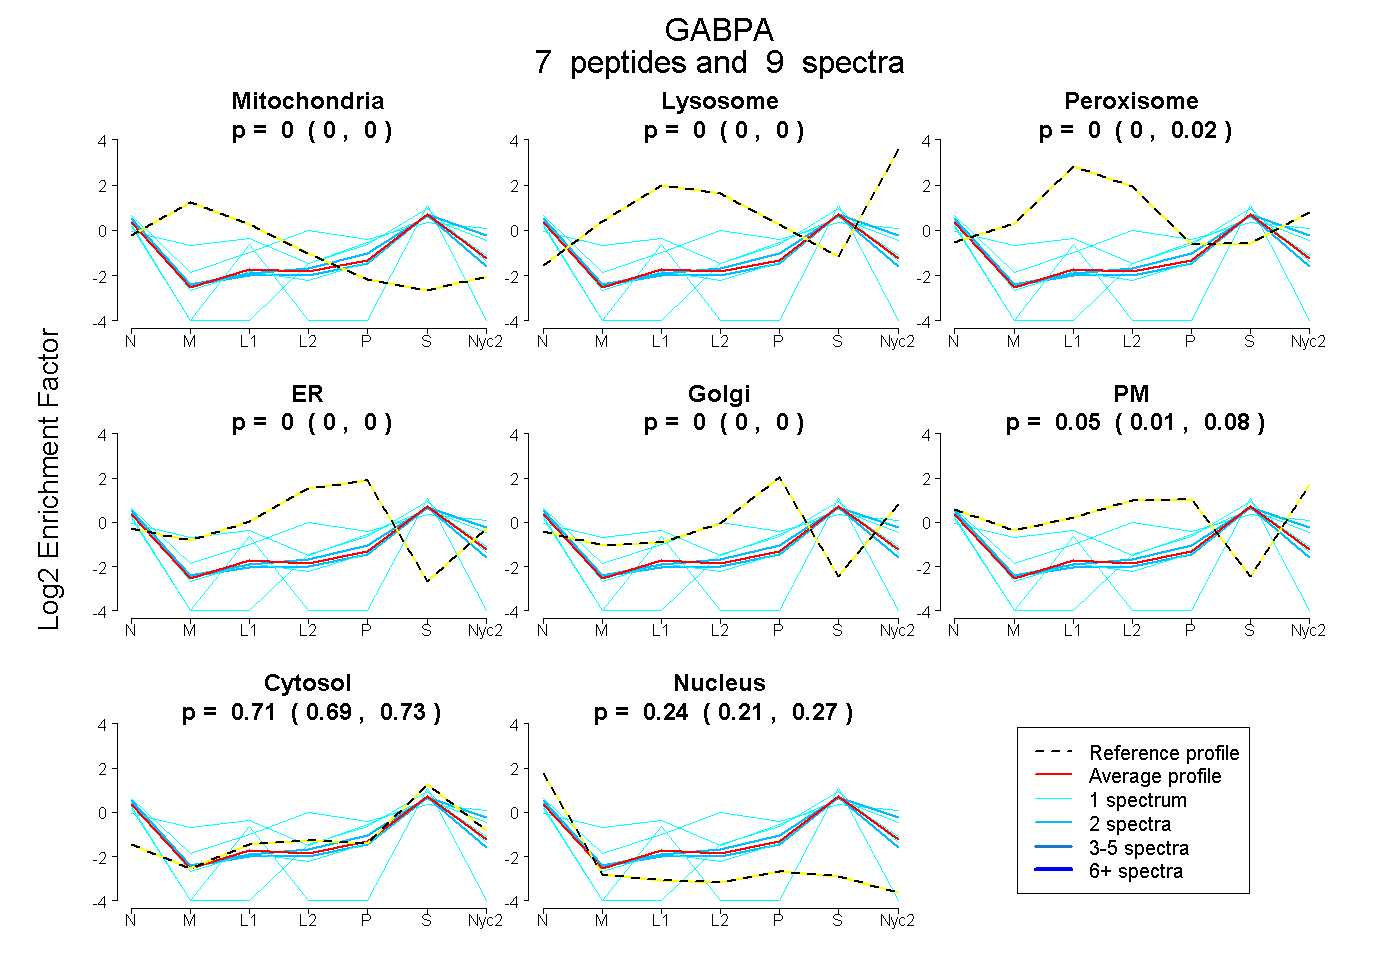
0.000 | 0.000
0.000 | 0.000
0.000 | 0.019
0.000 | 0.000
0.000 | 0.000
0.006 | 0.077
0.690 | 0.725
0.210 | 0.266
| Plot | Mito | Lyso | Perox | ER | Golgi | PM | Cytosol | Nucleus | |||||
| Expt A |
7 peptides |
9 spectra |
|
0.000 0.000 | 0.000 |
0.000 0.000 | 0.000 |
0.000 0.000 | 0.019 |
0.000 0.000 | 0.000 |
0.000 0.000 | 0.000 |
0.047 0.006 | 0.077 |
0.712 0.690 | 0.725 |
0.241 0.210 | 0.266 |
| 2 spectra, TLIGYSAAELNR | 0.000 | 0.000 | 0.000 | 0.000 | 0.000 | 0.060 | 0.668 | 0.271 | ||
| 1 spectrum, SLFDQGVK | 0.000 | 0.000 | 0.000 | 0.000 | 0.000 | 0.025 | 0.705 | 0.270 | ||
| 1 spectrum, HITTISDETSEQVTR | 0.000 | 0.000 | 0.000 | 0.000 | 0.000 | 0.402 | 0.563 | 0.036 | ||
| 1 spectrum, DCISWVGDEGEFK | 0.000 | 0.000 | 0.000 | 0.000 | 0.000 | 0.000 | 0.723 | 0.277 | ||
| 1 spectrum, FVCDLK | 0.184 | 0.000 | 0.056 | 0.000 | 0.000 | 0.174 | 0.586 | 0.000 | ||
| 2 spectra, LNILEIVK | 0.000 | 0.000 | 0.000 | 0.000 | 0.000 | 0.093 | 0.711 | 0.196 | ||
| 1 spectrum, GEILWSHLELLR | 0.000 | 0.000 | 0.000 | 0.000 | 0.000 | 0.000 | 0.479 | 0.521 |
| Plot | Mito | Lyso or Perox | ER | Golgi | PM | Cytosol | Nucleus | ||||||
| Expt B |
1 peptide |
1 spectrum |
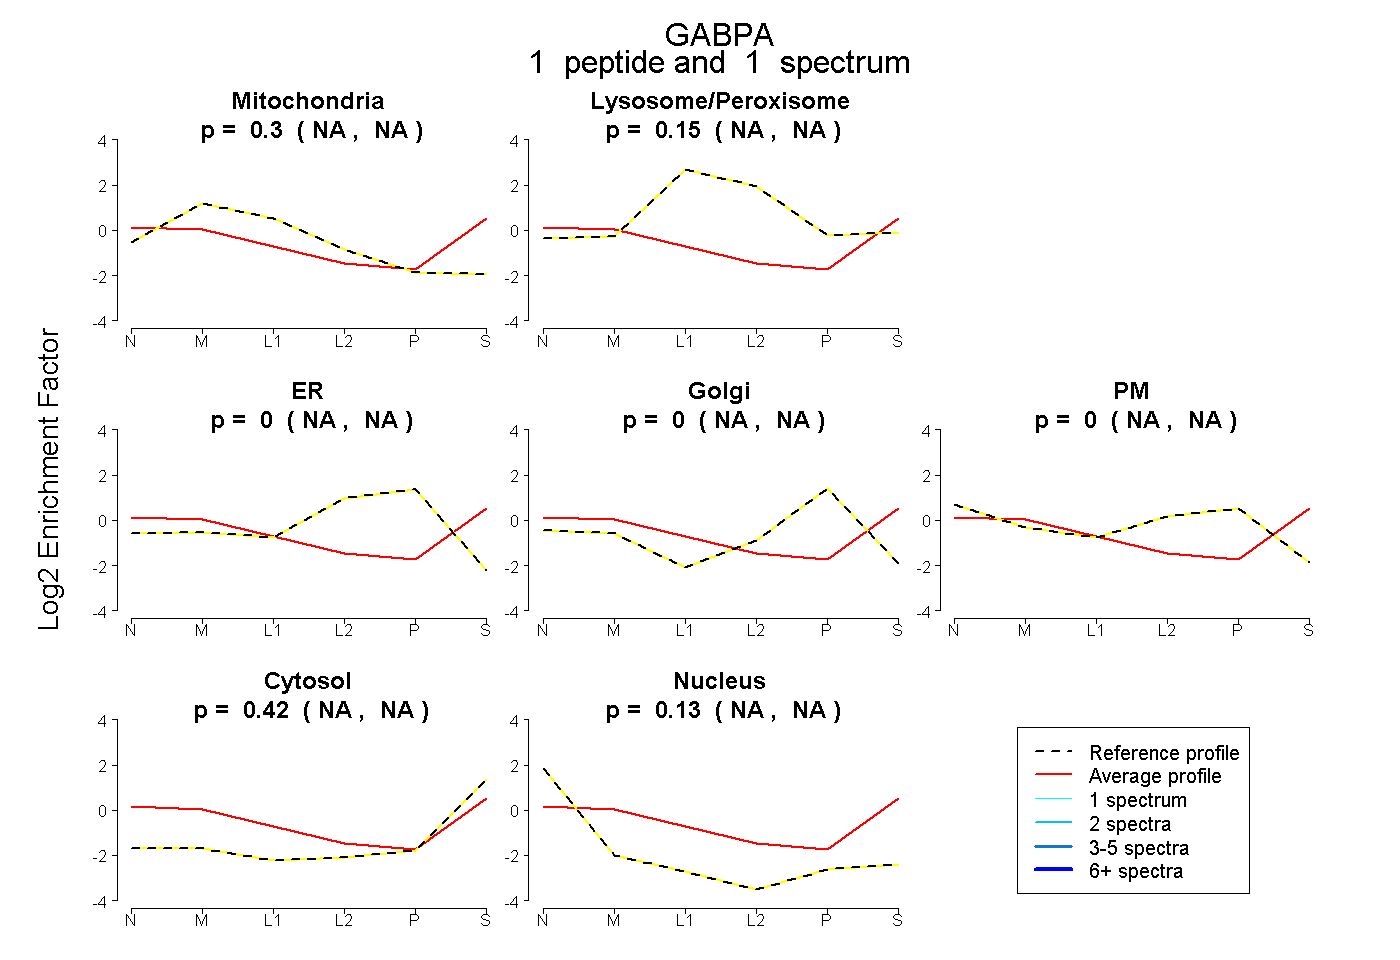 |
0.298 NA | NA |
0.151 NA | NA |
0.000 NA | NA |
0.000 NA | NA |
0.000 NA | NA |
0.424 NA | NA |
0.127 NA | NA |