 13
13peptides
spectra
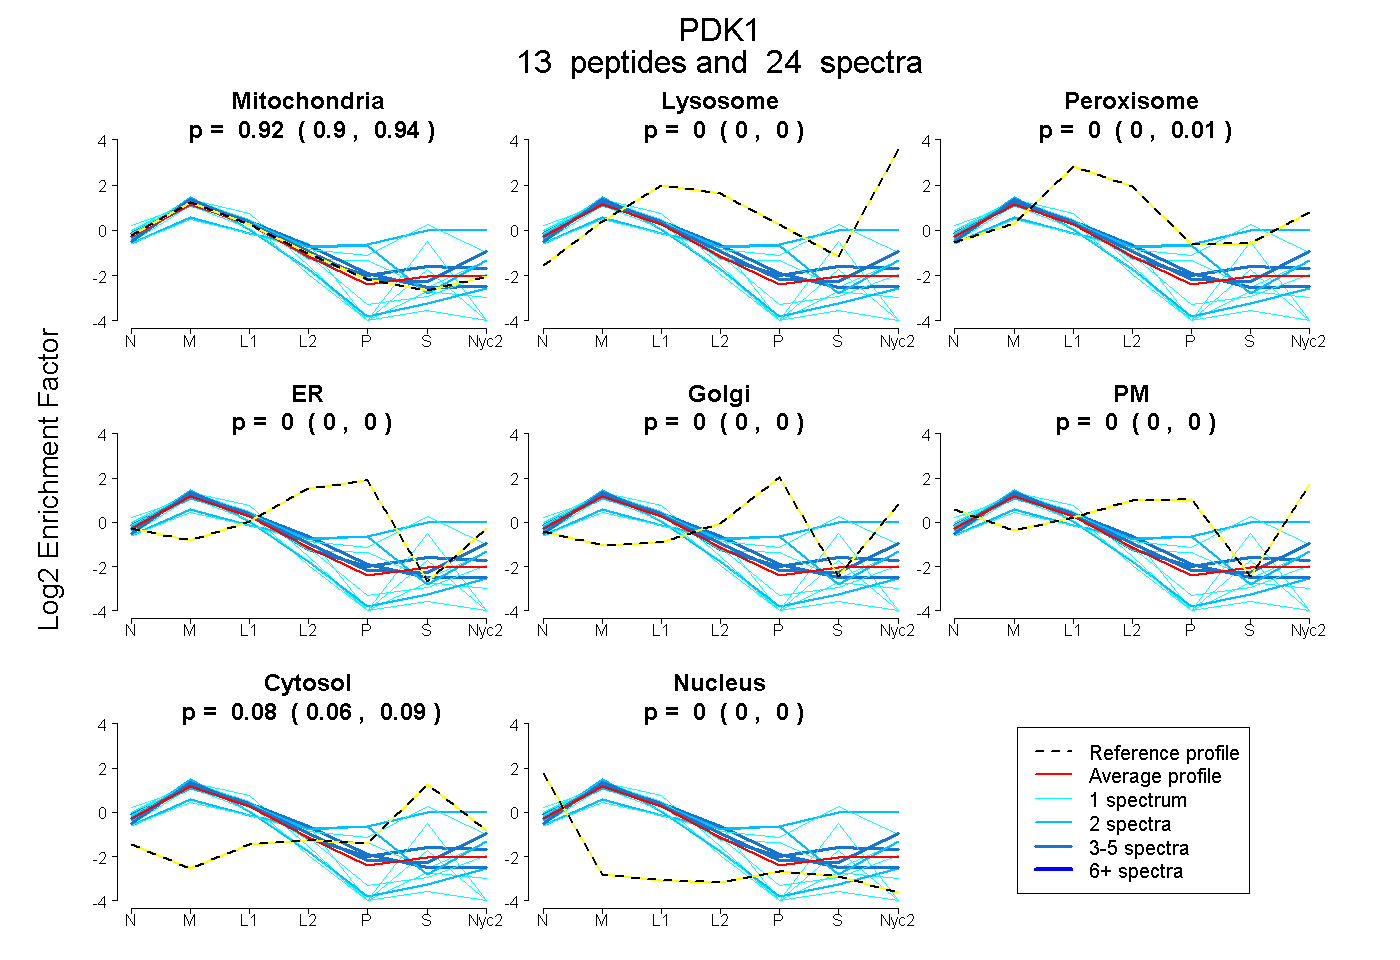
0.904 | 0.936
0.000 | 0.000
0.000 | 0.010
0.000 | 0.000
0.000 | 0.000
0.000 | 0.000
0.060 | 0.087
0.000 | 0.000
4peptides
spectra
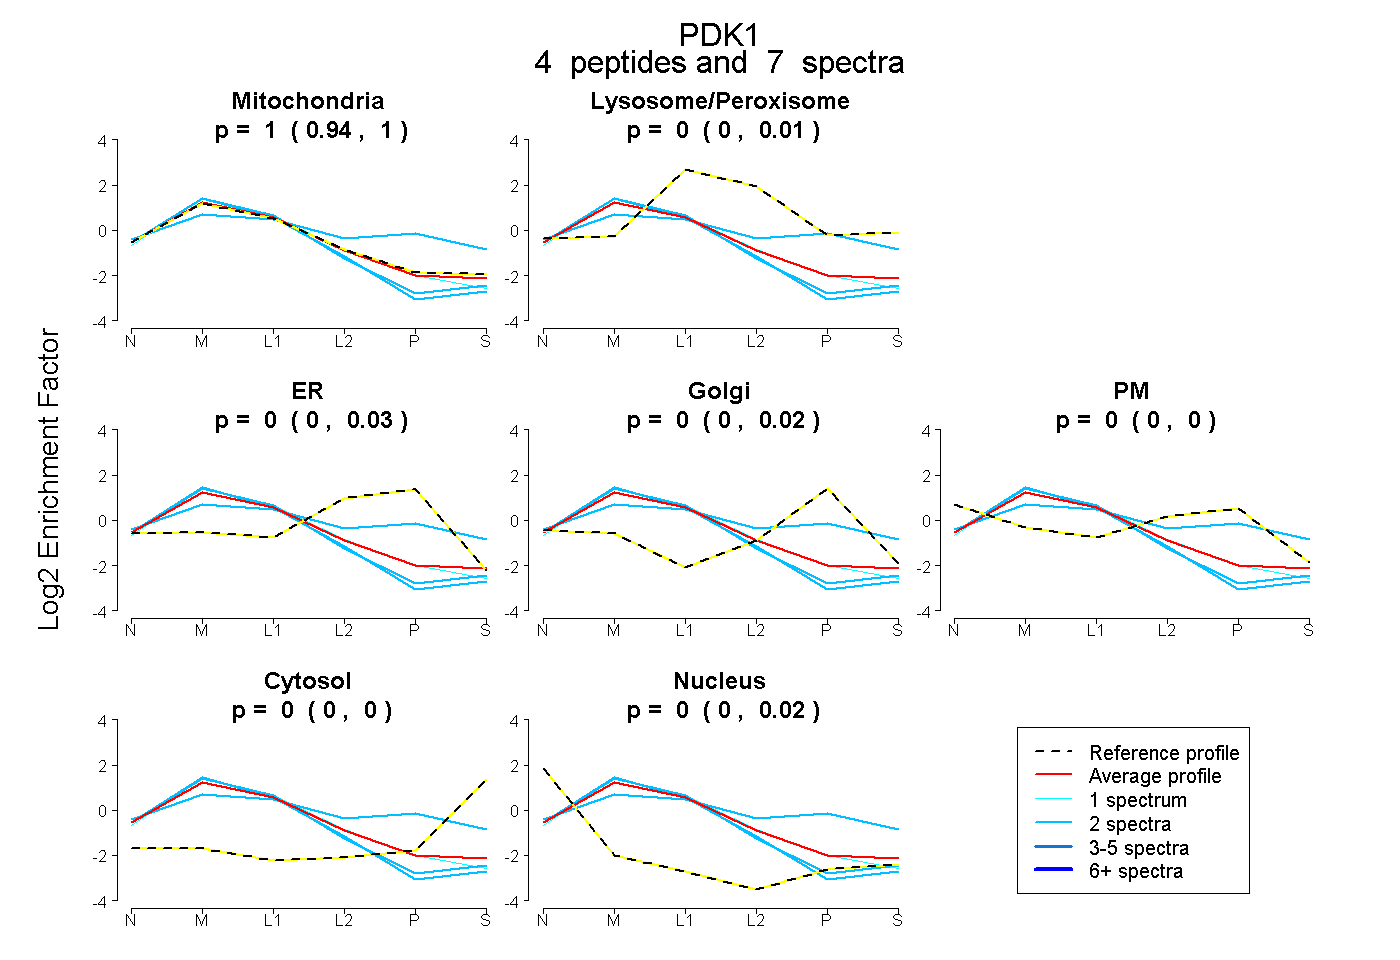
0.941 | 1.000
0.000 | 0.005
0.000 | 0.031
0.000 | 0.018
0.000 | 0.000
0.000 | 0.004
0.000 | 0.022
14peptides
spectra
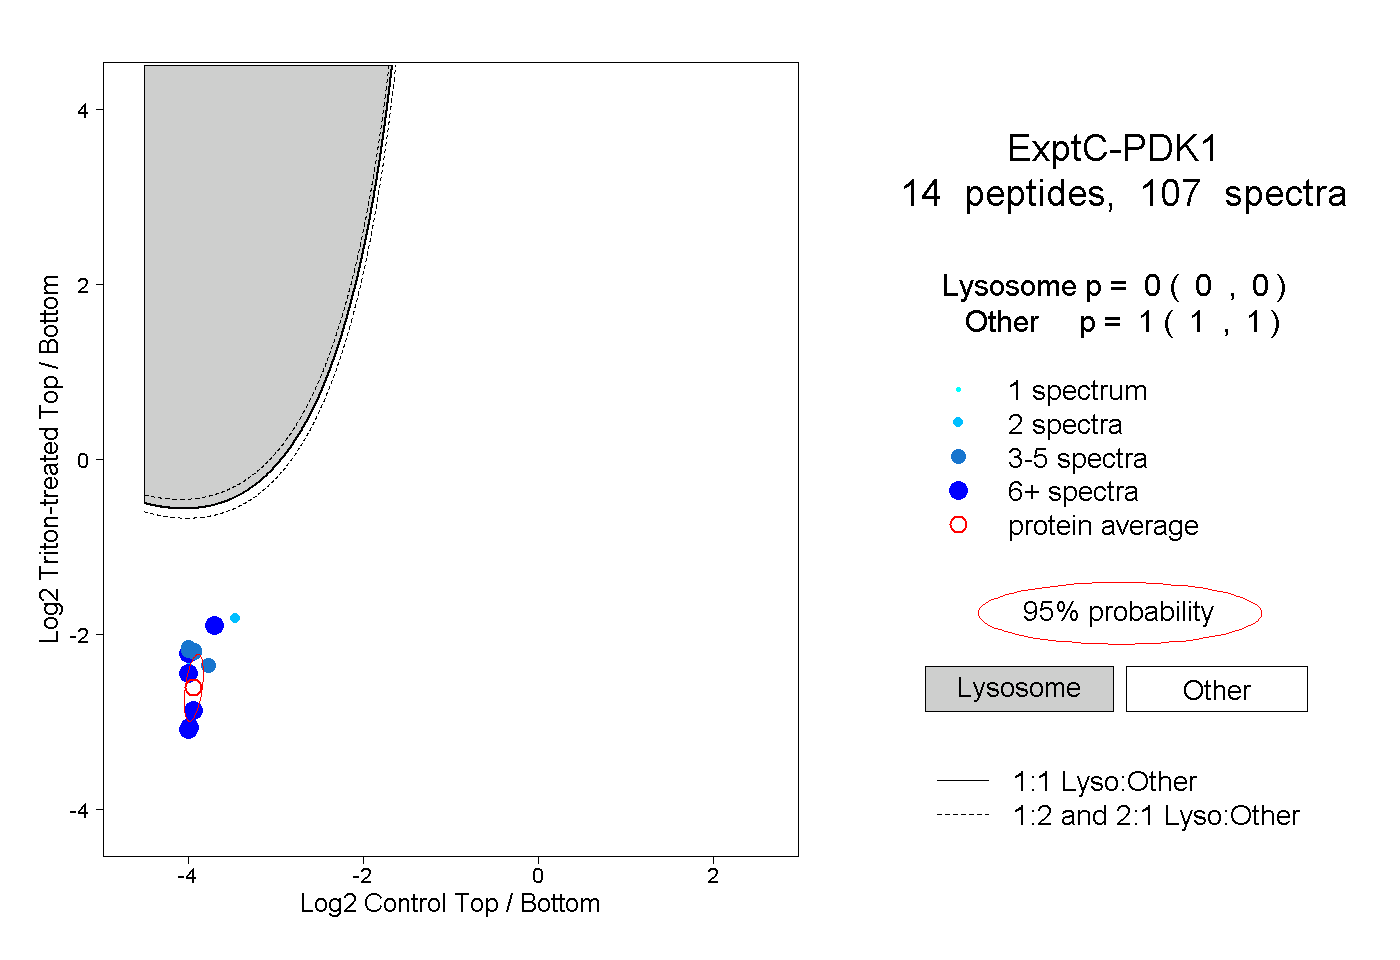
0.000 | 0.000
1.000 | 1.000
3peptides
spectra
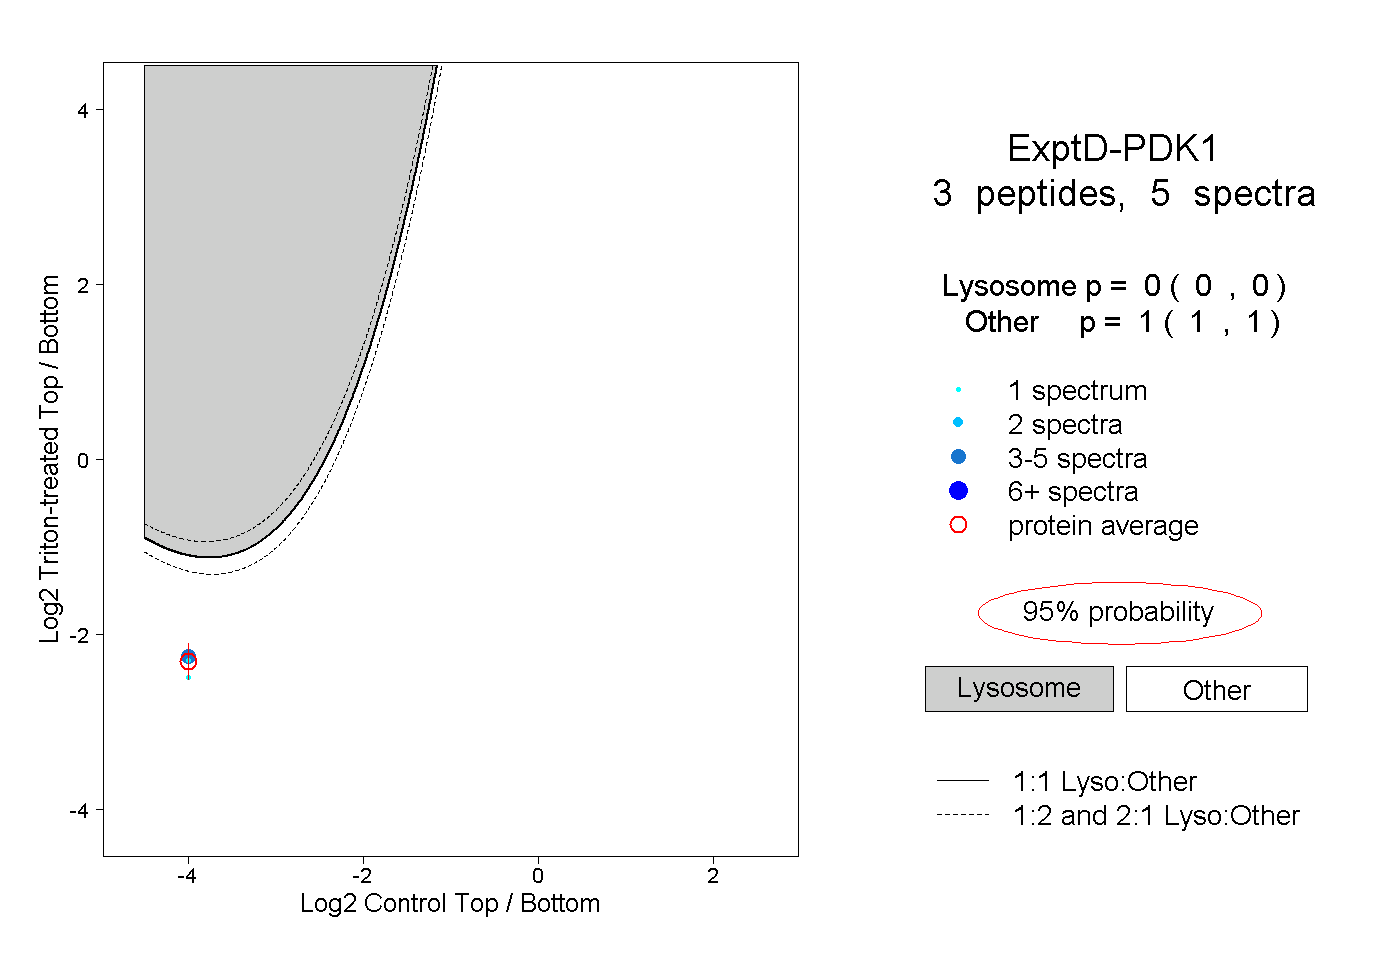
0.000 | 0.000
1.000 | 1.000